Use Import.io + Tableau to Analyze Extracted Web Data


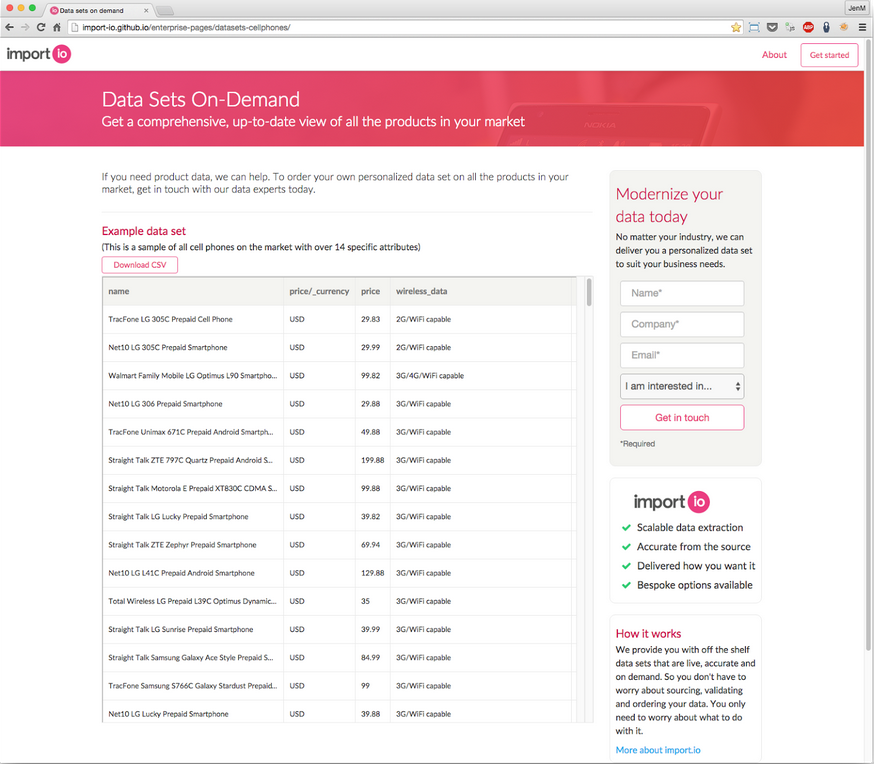
The web is an amazing source of data. It’s big, free, and constantly being updated. But data on the web is hard to access. That’s where Import.io comes in. It’s a web platform that turns websites into structured tables of data that are actually useful (like this). With structured data, you can find unique insights and spot new trends leading them to make better, more informed decisions.
Getting Started with Data
Import.io has been making waves in the web data extraction industry for a few years now, and has come to be the go-to platform for anyone who needs web data (and a personal favorite of many of us here at Tableau).
Import offers two unique ways of using its product. For the casual data user, it offers a free app with a simple point-and-click interface for building APIs to extract data. For the more advanced data consumer, it offers a data service that provides custom-built data sets at scale. These are pre-cleaned to fit right into your organization.
Whichever option you choose, Import.io is a fantastic tool for expanding your data-vizzing potential since it allows you to turn almost anything into data. Our own Jewel Loree has been using it since the early days to create vizzes for a variety of analysis, measuring compatibility with pet breeds to comparing the popularity of Halloween costumes, to dissecting radio playlists.
Getting started with Import.io is quick and easy, especially if you use the Magic feature. This tool uses an algorithm to detect and extract the data on the page automatically, often in less than 30 seconds! Check out this 15-second demo:
For more complex websites and features (like JavaScript-handling and crawling), you’ll need the free app. There are some great free online courses (check out CodeSchool and Udemy) that will teach you how to use the entire product, end to end. If you’re looking for inspiration on what to build, have a look at Import.io’s Showcase page for highlights of real-life use cases.
To give you an idea of what’s possible, let’s take a quick look at an example of how you can get data-driven answers using Import and Tableau.
Tackling a Data-Driven Question
Let’s say you’re a cellphone retailer. Your market research department wants to know which features consumers are willing to pay extra for, and whether there are any holes in the market. Individually eyeballing the specs and reading the reviews for each phone isn’t particularly scientific. Instead, to get a data-driven answer, you can use Import.io to create a data set of all the phones on sale. Then you can visualize that data set in Tableau to identify which phones consumers are happiest with, and at which price points.
Collecting the Data
The first thing to do is to collect some data. For this example, we’re using data from Walmart.com because it has lots of phones from all different carriers and in all different price ranges. To access this data, you’ll need to use Import.io’s app to build two APIs. The first will collect links for all the phones, and the second will look to a phone’s product page so we can extract the specs.
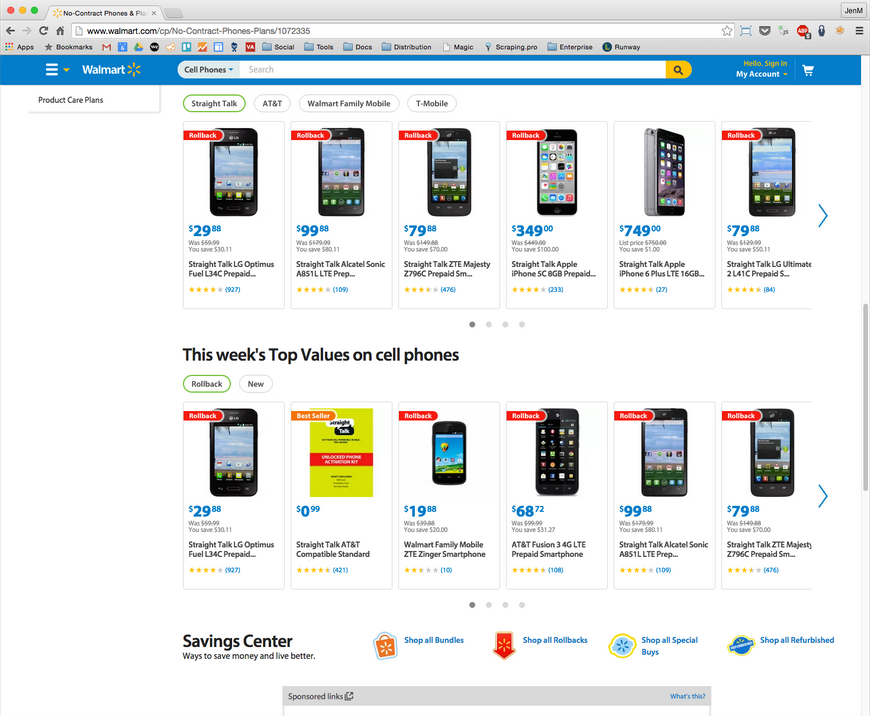
The first API extracts all the links for phones.
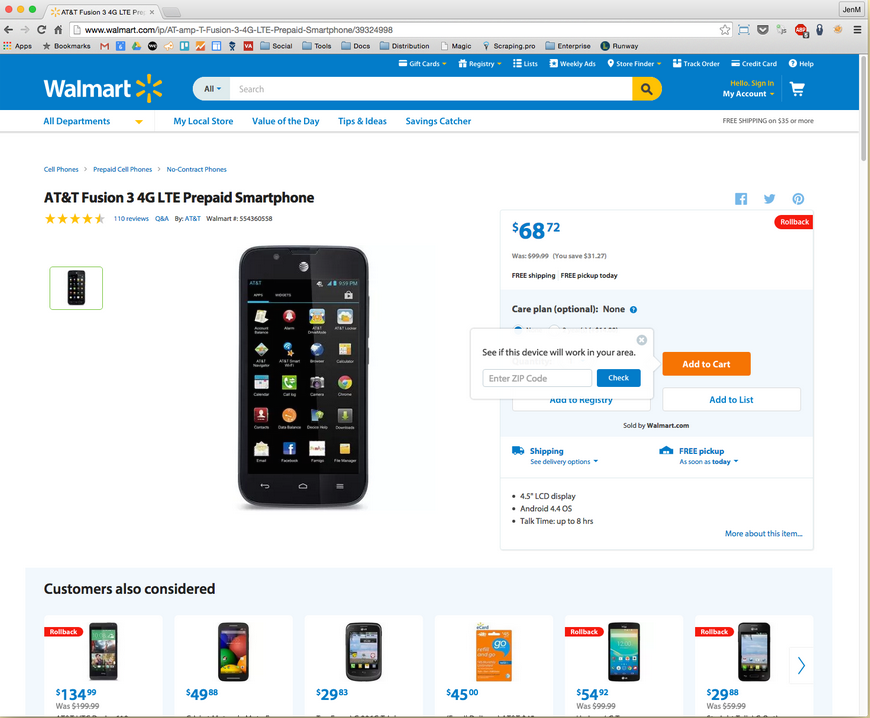
And the second API extracts specs from a single phone's product page.
Then, using Import’s Chained APIs feature, we can run all the URLs we collected in our first API through our second API to get all the specs for all the cellphones on Walmart.com.
It might sound complicated, but in general, the process is quite simple. And Import.io has loads of helpful tutorials to walk you through the process. Actually building the APIs only takes a few minutes and running them through one another is super-quick.
Using the APIs, we get a data set with around 400 phones and their specs including price, megapixels, Ghz, talk time, and average reviews. (You can have a look at the data here.)
The Data-Driven Answer
Once you have your data set, you can upload the file to Tableau. Then all that’s left to do is plot the average rating by the price for each phone into a scatter plot. Like so:

It’s only a simple viz from a single source, but already you can start to see some trends around which phones consumers like best. From there you can work backwards to identify what it is about these phones that consumers enjoy and what they don’t. This should give you a good framework for designing your next phone or pricing your current ones.
And that's just one example of using extracted web data. How do YOU use Import.io and Tableau? Share with us in the comments below.