#MyRecentViz: Where is my team in the league table?


Editor’s note: This piece is part of the #MyRecentViz series of blog posts and webinars, each deconstructing a beautiful and insightful viz. See here for previous instalments of this series.
UPDATE Feb 2018: Here are the vizzes for the 2017/18 season:
- Premier League 2017/18
- La Liga 2017/18
- Ligue 1, 2017/18
- Bundesliga 2017/18
- Eredivisie 2017/18
- Serie A 2017/18
The Question(s)
The European football leagues head into the home stretch. There are only a few games left in the continent’s major competitions. To get a better understanding of the standings, I created a series of visual league tables.
Usually, the requirement for vizzes to be featured in the #MyRecentViz column has been that they need to be driven by a clear research question. Here I am breaking my own rule. The vizzes were not built to answer a single question. Rather they are meant to be looked at every weekend to help answer a series of questions, such as:
- Where is “my team” with regards to the competition?
- How far ahead / behind are they compared to other teams?
- Generally, is the league more even, with an open race for the title, or are a few clubs dominating the competition?
But that’s OK. Sometimes vizzes are not an answer to a single question. Sometimes they are set up like dashboards, intended to be checked repeatedly. Yvan Fornes has written about how to approach such vizzes in an excellent blog post.
The Vizzes
Here we show the viz for the English Premier League – the most watched football league in the world. But the vizzes for the other countries are analogous.
For other leagues see:
- La Liga
- Ligue 1
- Bundesliga
- Eredivisie
- Serie A (Coming soon)
We have three tabs. The first is a bar chart showing the ranking of the teams from first place to last place and the points they have accumulated. The second shows the how many matches were won, lost, and drawn. The last shows goals scored, received and the goal difference. (For some leagues, there was data on the rankings over time as well, so these have a fourth tab with a so-called bump-chart showing that evolution through the season.)
The Data
The data is from Wikipedia. The tables are read into Google Sheets with the ImportHTML formula. Tableau Public refreshes the extract every 24 to show the latest data. See here for a more detailed description of this method.
The Charts
League tables are notoriously difficult to read and understand:
- First, while they show the ranking very effectively, they make it difficult to see how far the distances are between teams. Essentially they require you to do a lot of math to figure that out.
- Second, this is compounded by the fact that most match days are actually spread out over a whole weekend, meaning that one has to take into account the “number of games played”. Having a one-point advantage over a rival is not that reassuring when the other team has one game in hand.
- Third, when there is tie in the number of points the goal difference and/or the direct head-to-head results become important, depending on the league.
- Forth, because they try to squeeze in a lot of information, these tables often come with a lot of abbreviations – and it is not always clear what these stand for.
Here is a screenshot of a typical league table. You’ll see what I mean.

It seems that with the help of some visual representation at least some of these deficiencies can be mitigated. That’s what I wanted to try with these vizzes.
Now, I am not the first person to attempt a visual representation of league tables. In fact, Ryan Sleeper wrote about this topic here on this blog. Also a quick search of Tableau Public brings up vizzes like this, this, this or this one. The latter uses an interesting chart type - a dot plot - also utilzed by Zeit Online to visualize the gaps between the teams more clearly.
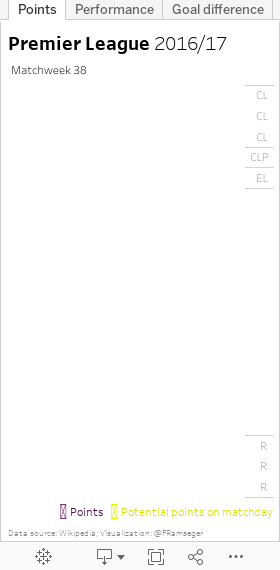
In my vizzes I chose to go for a simple sorted bar chart showing total points per team, for the main view. I also added segments to the bars with potential points, if the teams have outstanding matches still to be played in the particular match week. This helps to see whether a team can still overtake another team on that match day, without having to do too much mental arithmetics, making sense of both points and number of games played.
The other information, such as number of games won, lost and drawn as well as the goals fielded, goals conceded and the goal difference were relegated to the second and third tab respectively. These appear to be secondary information to me.
While the stacked bar chart on the second tab was straight forward, it took me a few tries to find an adequate way to display the goal difference visually. Of course I could have just gone for a bar chart, with positive values going to the right and negative values to the left, but I wanted to include that additional information about how many goals a team scored and how many it conceded. The reason being that I think it is interesting to see how the goal difference comes about. Is it a more offensive team that scores more goals, but also concedes many? Or is this a more defensive team where fans rarely get to see any goals on either side of the pitch?
I ended up using a double axis chart with the goal difference as a dot plot overlaid on top of the bars for goals scored and conceded. I gathered a bit of feedback from a few people on this chart type, and I know that opinions are divided on this one, but personally I liked it enough to keep it that way.
The Design
As you might have guessed, the size of the viz is intended to fit on a mobile screen, allowing people to check the rankings from anywhere, at any time. The space constraint meant boiling things down to the essential bits. For instance, I decided not to spell out the team names, instead hiding them in the tool tips – true fans, of course, will recognize their team’s crest.
In terms of the colors, I like the idea of having popping, solid foreground colors on a white background. The inspiration for those colors came from the logos and websites of the respective leagues. I figured fans would be familiar with those. For values that represent opposite things (such as goals scored and goals conceded) I tried to use contrasting colors where possible.
Closing Thoughts
As the season comes to an end, I am already thinking about how to improve upon these vizzes for the next season. One thing I was initially hesitant about, but what I am missing now is a reference line to see how many points the teams had in the previous season. See here for a similar viz that demonstrates this idea.
The other thing that has been bothering me is that the goal difference is actually not accessible enough, when comparing two teams that have equal points according to the bar chart. I had added the information into the tool tip. But what I really want is to be able to see it visually right there in the first view. It would be great to put the goal difference chart into the tool tip, once the “viz-in-viz” feature announced at #data16 is available. But perhaps there are other ways to squeeze in both points and the goal difference in a mobile-friendly viz? Let me know on twitter (@FRamseger) if you have any ideas!
관련 스토리

Iron Viz 2026: Read Between the Data
 2026/05/28

Tableau's Iron Viz Winners

Explore the 2026 Iron Viz Entries
 2025/12/15