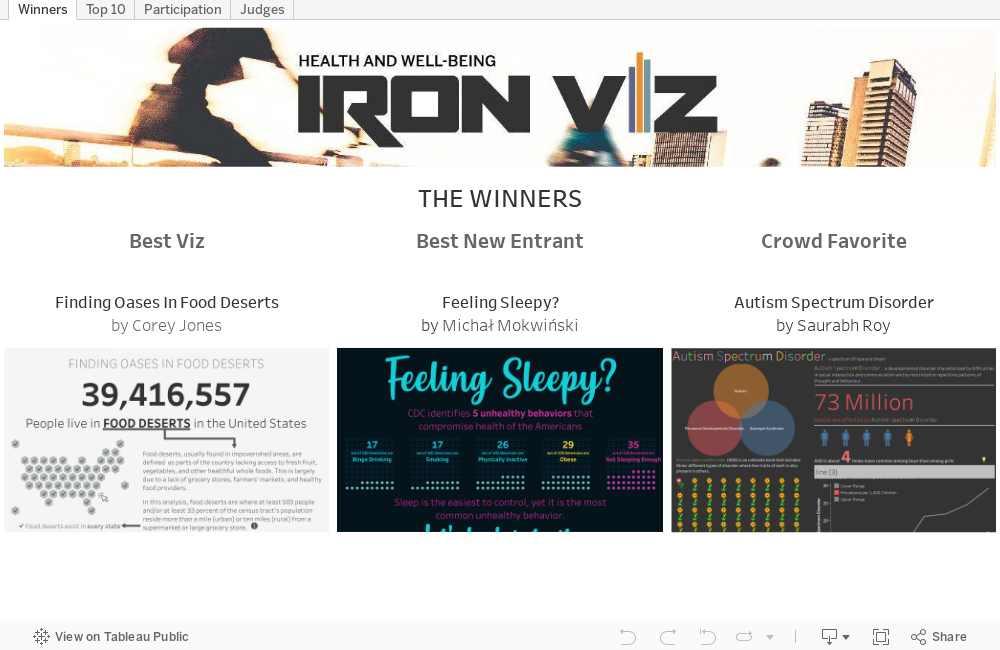
Iron Viz Health and Well-being: The Winners


We have a winner! We knew this Health and Well-being theme would inspire you, and were expecting a blend of quantified-self, disease-focused and health awareness vizzes. You didn't disappoint! The fantastic 60 submissions we received have been scored, and it is now time to share the results.
To help us determine the winner, we were delighted to welcome some famous data viz experts as guest judges:
- Nadieh Bremer, freelancing data visualization designer and artist with a background in data science
- Max Roser, economist working at the University of Oxford, and researcher on inclusive and sustainable growth
- Mona Chalabi, journalist whose data sketches have been commended by the Royal Statistical Society and Information is Beautiful in 2016
- Andy De, senior industry director for Healthcare and Life Sciences at Tableau Software
And without further ado, let's jump to the part you are all waiting for!
Crowd Favorite
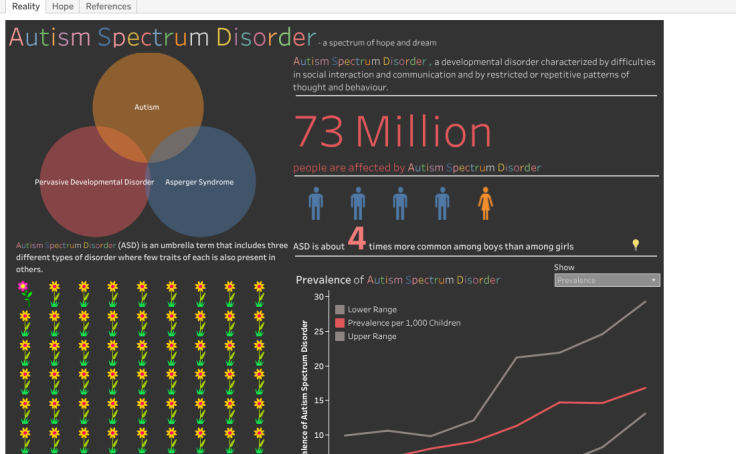
This viz racked up the most favorites of any in the contest, currently with 100 favorites.
Best New Entrant
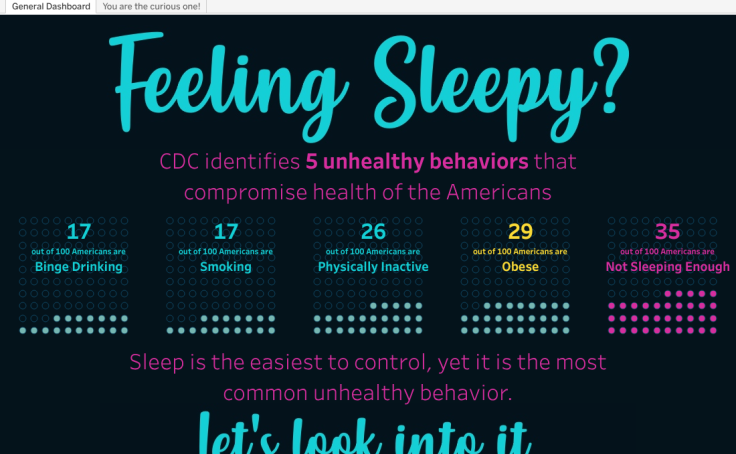
This was Michal’s first time participating in an Iron Viz contest, and he finished in second place!
And the winner is...
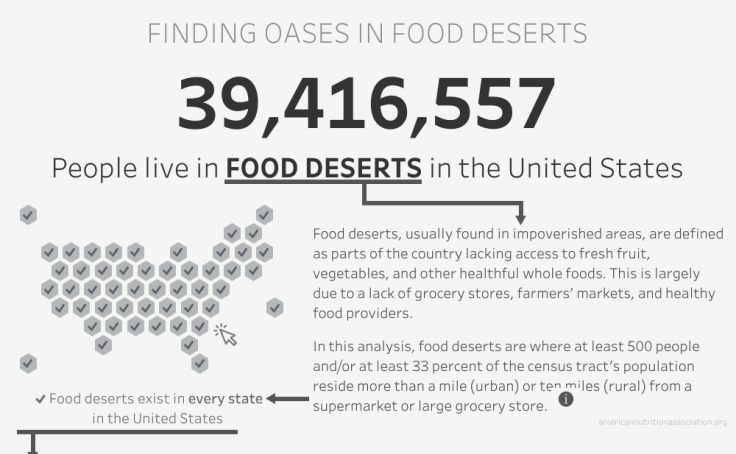
Congratulations, Corey! You are the second contestant confirmed for Iron Viz at Tableau Conference 2018.
The Scores
The same scoring process from our previous contest was used, where a team of six tableau employees (KJ Kim, Jonni Walker, Jade Le Van, Florian Ramseger, Scott Teal, and Fish) scored the entries to create a shortlist of ten vizzes for our expert data viz judges to score. Each viz has been reviewed by our judges, and assessed on analysis, storytelling, and design.
Many thanks to all of you who participated by submitting a viz, as well as by voting for your favorite(s)! And of course, a big thank you to all our judges for their eager eyes. Stay tuned for the announcement of our next contest on August 1st. This will be your final chance to earn your spot competing on-stage at Tableau Conference 2018!
관련 스토리

Iron Viz 2026: Read Between the Data
 2026/05/28

Tableau's Iron Viz Winners

Explore the 2026 Iron Viz Entries
 2025/12/15