Explore the Iron Viz entries on Joy + Data


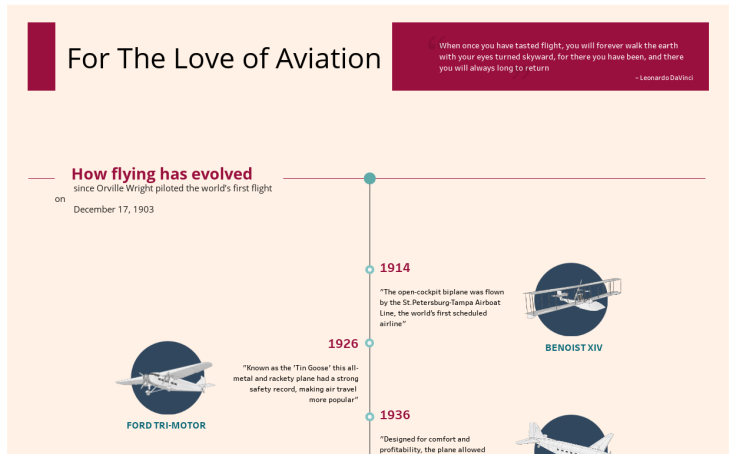
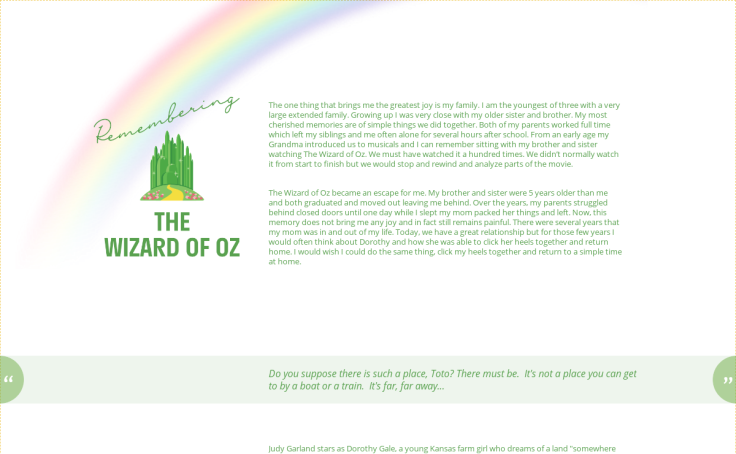
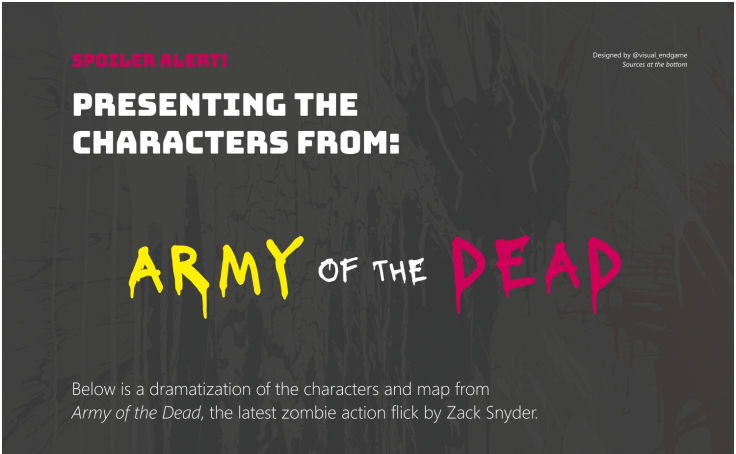
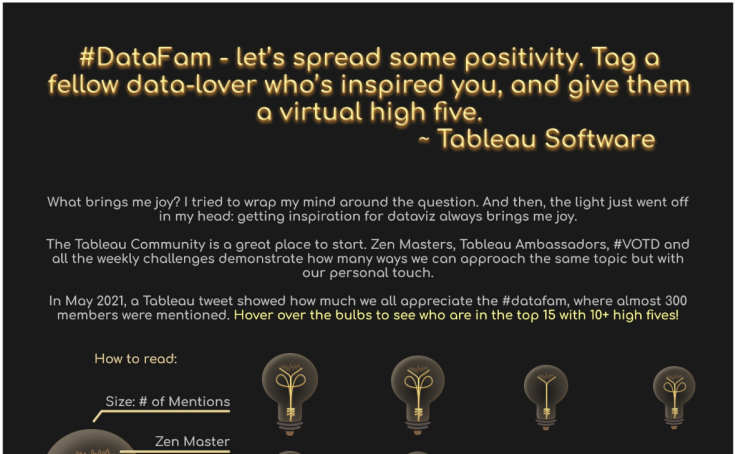
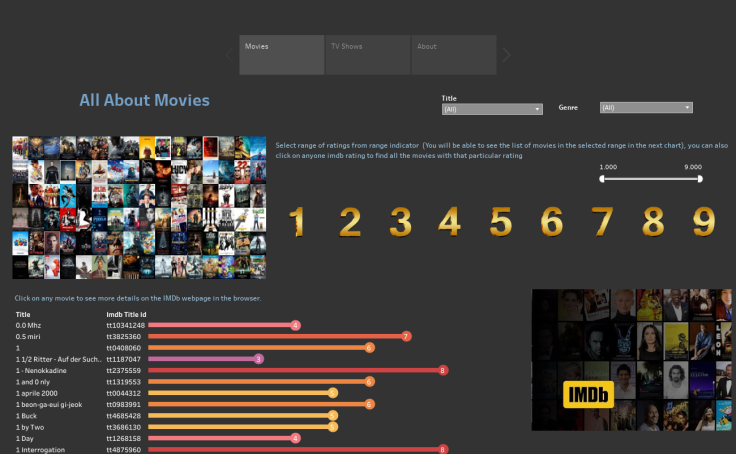
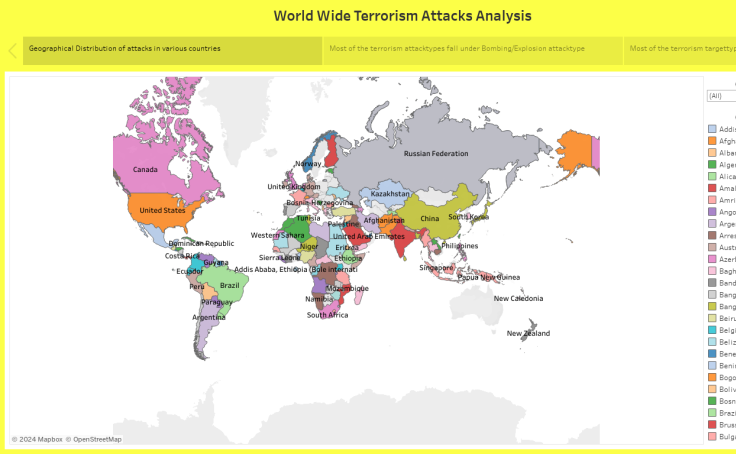
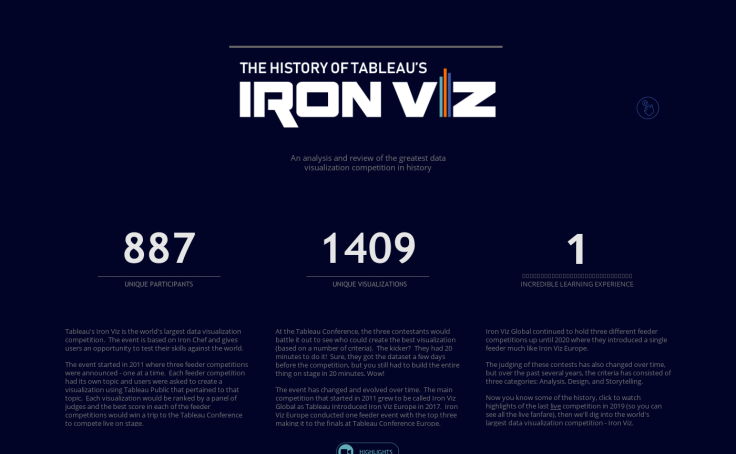
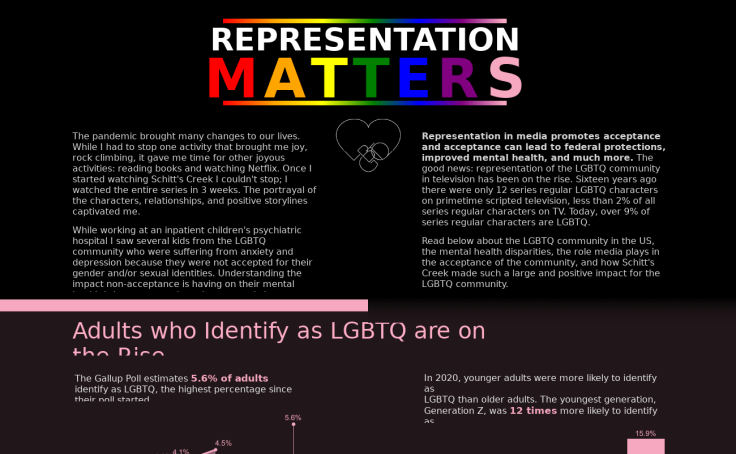
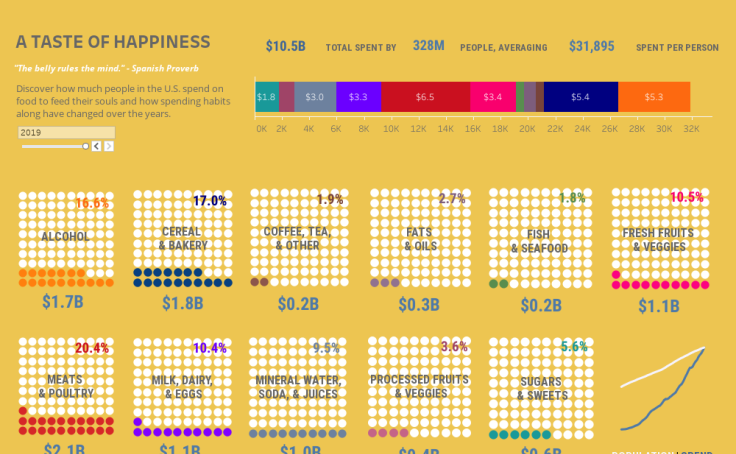
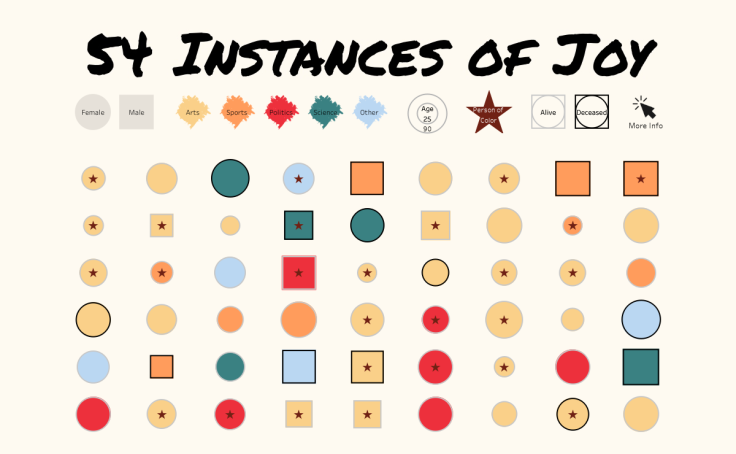
The entries are in! Ready to be impressed by the 320 mind-blowing vizzes submitted during the 2021 Iron Viz global qualifier contest? Explore the visualizations below to learn what brings joy to the data rockstars who participated in this year’s data visualization competition.
What's next? Over the next weeks, a panel of esteemed Tableau Community judges will review the submissions and score them according to the following criteria:
- Design: How appropriate is the design for the story that is being told?
- Storytelling: Is there a clear story being told or question being explored, and is there appropriate context?
- Analysis: How sophisticated and appropriate is the data that is being used for the story?
The three finalists of the global qualifier contest will advance to the virtual Iron Viz Championship for a chance to win up to $10,000! For more information on prizes, please visit the the contest page.
Anxious to find out the results? Us too! But the judges need time to review all the entries. Register for this virtual User Group happening on August 12, where we'll announce our top ten entries, as well as the three finalists that will advance to the Iron Viz Championship at the Tableau Conference in November 2021.
Entering Iron Viz is no easy feat. We’re so proud of each and every member of the community who took the time and energy to enter. To show them your support, be sure to favorite their vizzes below and follow them on Tableau Public.


관련 스토리

Iron Viz 2026: Read Between the Data
 2026/05/28

Tableau's Iron Viz Winners

Explore the 2026 Iron Viz Entries
 2025/12/15