An Analysis with Teeth
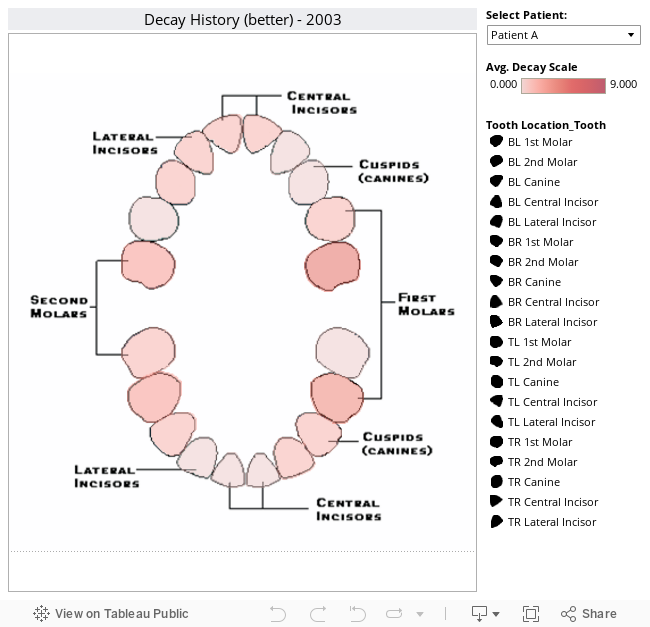
There are many ways to visualize data – including overlaying it on existing images. In this case, data about tooth decay is plotted on top of an image of a mouth and can be visualized over time in multiple ways. One way is to show a series of small multiples. Another way is to use Tableau’s “page shelf” feature, which enables filters to be viewed consecutively and automatically as individual pages and creates a mini “movie” of the data changing. Download Tableau Reader or Tableau Desktop to experience the effect.
Want to get started creating your own Tableau visualizations? Try It for Free