
Streamlining sources and promoting data culture: the MutuiOnline Group's approach
Creation of specific data assets by line of business and standardized dashboards for quick and organized access to information
Increased usability of data for business users, thanks to intuitive tools for consulting data and generating automatic reports
Increased user base able to make data-driven decisions and analyze business trends faster
The Internet company’s history is inextricably linked to one of the most interesting periods of the digitalization path affecting the Italian system: that of the web economy. Gruppo MutuiOnline (MOL) was founded as a startup in 2000 by its two founding partners, Marco Pescarmona and Alessandro Fracassi, and with its first comparison portal, MutuiOnline.it, it immediately established itself in the world of financial services. Year after year, the company expanded activities in other areas of product comparison and brokerage for individuals and in the area of outsourcing solutions for companies. The Group is, in fact, one of the first successful Italian FinTech companies and in 2007 was listed on the Italian Stock Exchange in the STAR segment; today it has more than 2,000 employees and more than 30 companies spread across 14 locations in Italy and abroad and operates with two distinct divisions: Broking and BPO (Business Process Outsourcing).
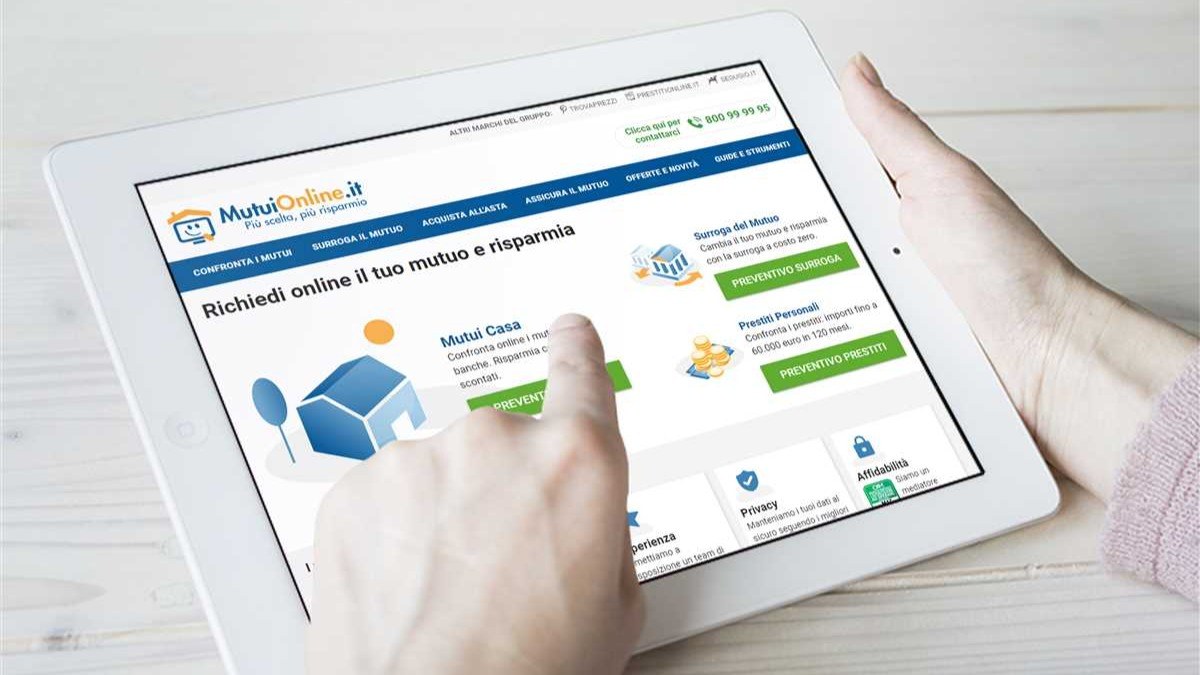
The first is Italy's leading online comparison, promotion and brokerage of financial, insurance and e-commerce services and products through its varied retail brands, including MutuiOnline.it, PrestitiOnline.it, Segugio.it, SOSTariffe.it and TrovaPrezzi.it. The second deals with the outsourcing of high value-added processes on behalf of banks, financial intermediaries, insurance companies, investment companies, and rental/leasing companies.
Refining and evolving technological skills is key to the continued growth of the MutuiOnline Group, and the transformation of analytics tools fits right into this evolutionary journey, which is far from over.
The underlying need
The project to rethink the analytics infrastructure underpinning the Broking Division's activities began more than two years ago with the pandemic, which accelerated a transformation process that was already underway.
In-house analytical skills were reflected in many small vertical reporting tools customized by lines of business (the main ones being mortgages, insurance, tariffs, loans, ...), but at the same time in data knowledge concentrated in a few people. Thus, it was not uncommon to have inefficiencies due to data analysis based on multiple versions of the truth.
As Andrea Proserpio recalls, "There was a need for the rationalization and harmonization of data management methods. So a project was undertaken to find a more agile solution to manage access to data and thus expand the pool of users who could make data-driven decisions." On the specific instructions of top management, the reorganization of reporting activities was initiated. The initiative, launched in Q2 2020, has over time involved all major lines of business and has focused on simplifying logic in order to have reusable data models and create a strong user community, which now numbers about 70 people.
The choice of Tableau
Given this background, we needed a tool that was flexible and easy for end users to use. Software selection was conducted with three well-defined criteria: tool functionality, ease of use for business users, and cost. Tableau was selected, and after the successful completion of the first concept proofs, we moved on to the implementation of the first vertical module (dedicated to insurance products), which took only three months. "The priority, Proserpio adds in this regard, was to create specific business data asset lines that were easily usable, with precise data line governance and without completely disrupting the previous approach.
The goal was to keep users on board without scaring them, so we started training immediately. It was crucial to create the first reports together; in this way we saw confidence in the data and the tool grow rapidly." The Tableau platform has responded fully to this task, confirming the peculiarities of a very intuitive solution for which it was chosen and ensuring that the Broking Division can put in place an organic system of data analysis and processing, which is the subject of continuous improvement. Today it is used by virtually all business users in the Division and is meeting the need for standardized dashboards to allow users to access inherent data information and certified KPIs in a quick and organized manner, ensuring complete technical sustainability of the analysis activity.
Benefits obtained
The benefits of implementing Tableau, as those involved assure, are most evident in the usability of the data for end users and the increased maintainability of the data models. As evidence of this, the “main” sources for each line of business host half of the organization's reports.
In these last two years we have had a strong focus on standardizing and democratizing data, trying to implement a self-service model supported by frequent training and coaching from the central team.
Nicoletta Papucci: Our role has been twofold: on the one hand, we have built and manage a machine that allows everyone to easily access the data assets, and on the other hand, we have been very focused on training users so that the company becomes increasingly data driven."
From this point of view, an illustrative figure of the results achieved relates to the percentage of reports generated directly by end users, which account for two-thirds of the total. At the moment, as Papucci goes on to explain, "It is difficult to quantify precisely the return on the investment made, but it is certain that using Tableau has enabled us to take a step forward both in our relationship with our business partners and in the speed with which we can analyze business trends; the level of data quality we are gradually achieving could also lead us in the future to measure the effectiveness of the solution in a more tangible way."
Future developments
This is the first step in the transformation of data management for the MutuiOnline Group, which now is looking to strengthen the back end. "Thanks to the Tableau platform, Proserpio concludes in this regard, and the surprising autonomy of the users, we have consolidated the reporting structure. Now we can lean on the data modeling front and further improve data governance while maintaining control of what is produced at the reporting level. This, at the moment, is the most important challenge."
In parallel, much attention will be given to consolidating what has been done so far and extending analytics best practices to smaller lines of business and serving the development of machine learning algorithms, which are strategic for supporting growth.