Jumpstart Your Analysis Using Accelerators from Tableau Exchange


The Extension Gallery that you know and love is now the Tableau Exchange, and it has an even greater mission. The Tableau Exchange is your one-stop shop for offerings to jumpstart your data analysis to answer questions and get actionable data quickly. It’s where you can access trusted offerings built by both Tableau and our partner network to help you see faster time to value, address a large variety of use cases, and ultimately realize a greater return on your Tableau investment.
You may already be familiar with Dashboard Extensions and Connectors that were in the Extension gallery.
- Dashboard Extensions allow you to add functionality to your dashboards using web applications
- Connectors enable Tableau to access additional databases and applications
Now, we’re expanding the offerings available to you by adding Tableau Accelerators. Formerly called Dashboard Starters, Accelerators are expert-built dashboards that help you dive straight into problem-solving and create robust visualizations in minutes—even if you don’t consider yourself an analytics expert. We have over 100 Accelerators in over seven languages to help you get started fast for use cases across diverse departments, industries, and enterprise applications.
What are Tableau Accelerators?
If you’re not already familiar with Tableau Accelerators, they’re ready-to-use dashboards and workbooks. Created by industry and functional experts, they are meant to help you bring analytics to your line of business, vertical, or sector. Rather than starting with a blank canvas, you can now start with an expert-built dashboard for a variety of industry and departmental use cases to get data-driven insights faster. These pre-built assets are designed to help you monitor and improve KPIs across your entire business.
Take our healthcare offerings, for example. We’ve added Accelerators that help you dig into metrics like patient wait time, the seasonality of admission rates, readmission rates, and more. Beyond industry dashboards, we have a host of Accelerators related to many lines of business functions like marketing, sales, and corporate finance. And of course, we still have Accelerators that connect you to critical enterprise applications and cloud services like Salesforce, Marketo, LinkedIn, Service Now, among others.
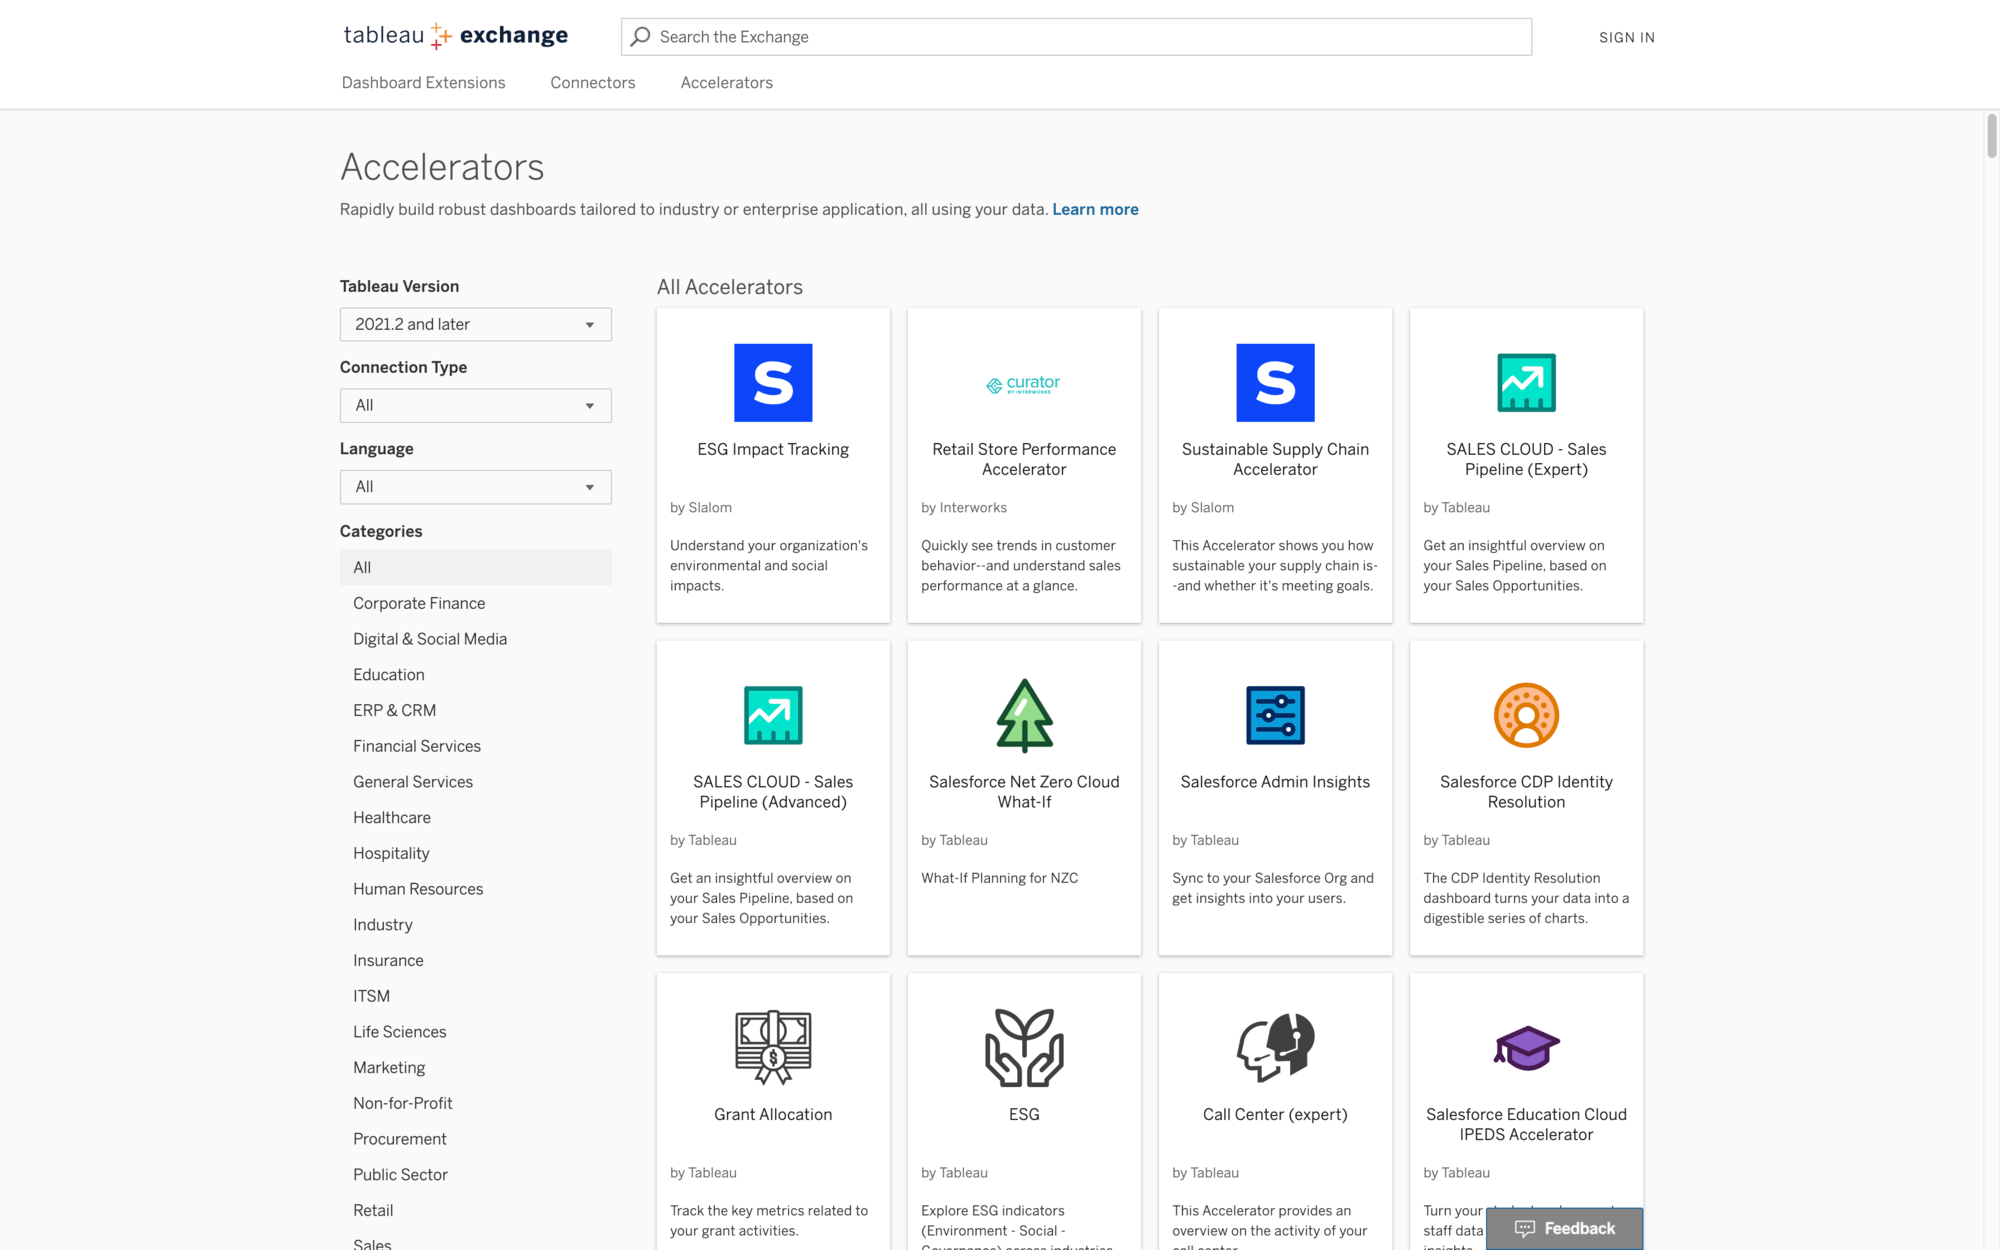
Figure 1: Explore Tableau Accelerators on the Tableau Exchange.
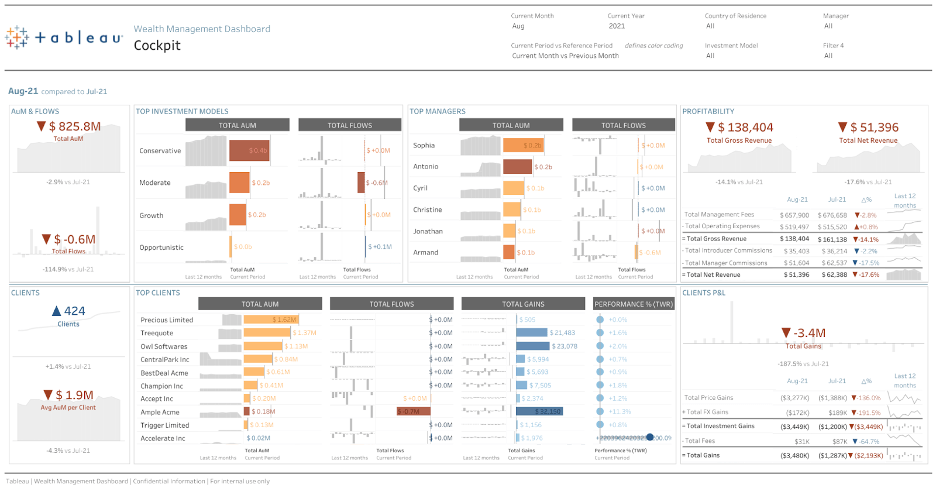
Figure 2: Dashboard showing front-office activities of a financial services organization created with the Wealth Management Tableau Accelerator.
How to get started with Tableau Accelerators
Accelerators are now live in the Tableau Exchange. To get started, simply navigate to exchange.tableau.com/accelerators. From there, you will be able to browse and filter by Tableau version, connection type, language, industry, or job function. The listings describe key information about using the dashboard, what business questions it can help you answer, required attributes, demo scenarios, or potential partners that can support customization to fit your needs.
Once you’ve found an Accelerator to jumpstart your analysis, download the workbook, and open it in Tableau Desktop. Now, you can view a version of the dashboard with sample data. Once you’re ready to swap out your data, select the Data Source tab and choose or search for the data source you want to connect to this workbook. If this is an enterprise application Accelerator, your own data will be populated for you by simply navigating to the Data Source tab and entering your credentials. See the Accelerators for Cloud-based Data article and other Tableau Help documents for more information.
Our industry and line of business dashboards are set up to connect to your published data source already in Tableau. Don’t have one set up yet? Getting started is as easy as navigating to the Data Source tab, entering your credentials, and building your data source from there. Want to double-check that you’ve got all the right fields? No problem. All our accelerators contain information about the required fields and their format already in the listing description.
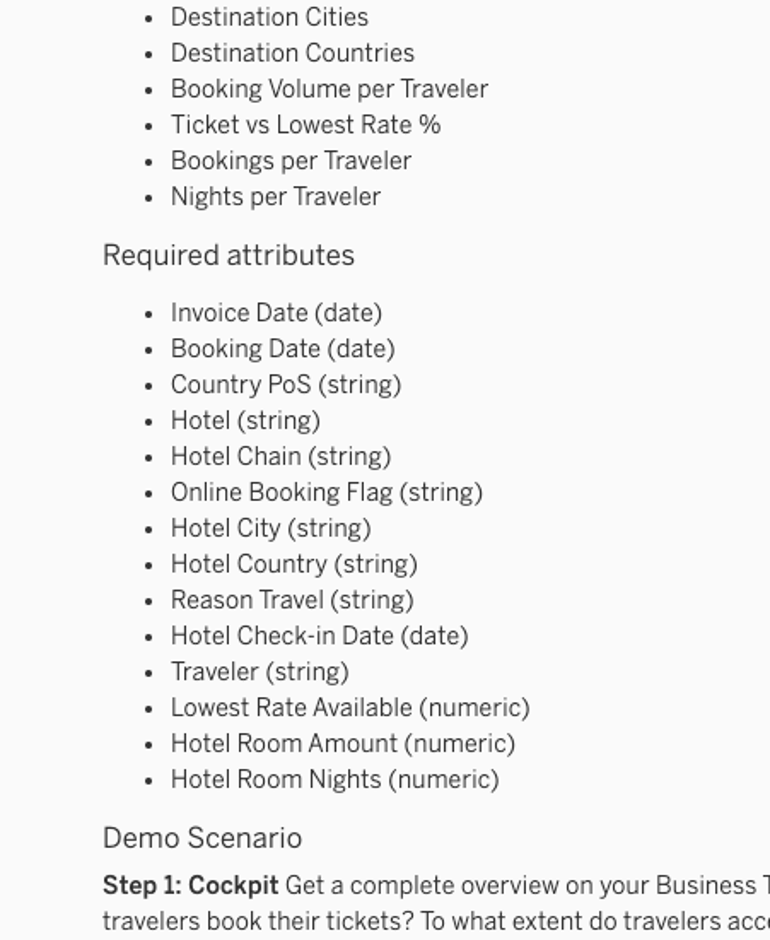
Figure 5: Accelerator listing description showing required fields or attributes for the dashboard.
Still not feeling confident? Feel free to reach out to an industry partner who is listed in the Partners of Choice section on the Accelerator listing on Tableau Exchange. Partners can help you set up this dashboard and help you better understand what analytics can look like within your organization, supporting you with custom solutions and services.
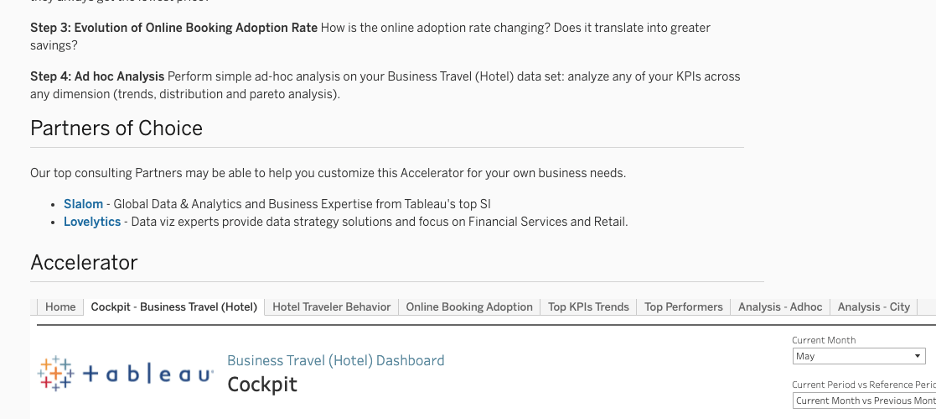
Figure 6: Example of Tableau Accelerator listing on the Tableau Exchange with partner information.
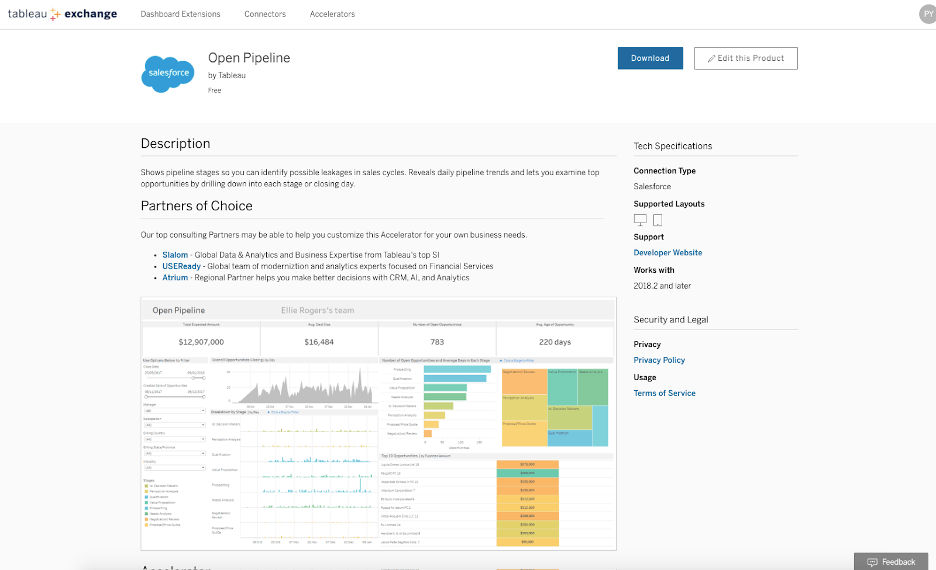
Figure 7: Open Pipeline Tableau Accelerator listing on the Tableau Exchange.
Inspiration to make Accelerators your own
Since they were launched during Tableau Conference TC21, customers and community members have been able to take Accelerators and customize them for their own specific needs. Below we share a few examples of what some have done—and you can too.
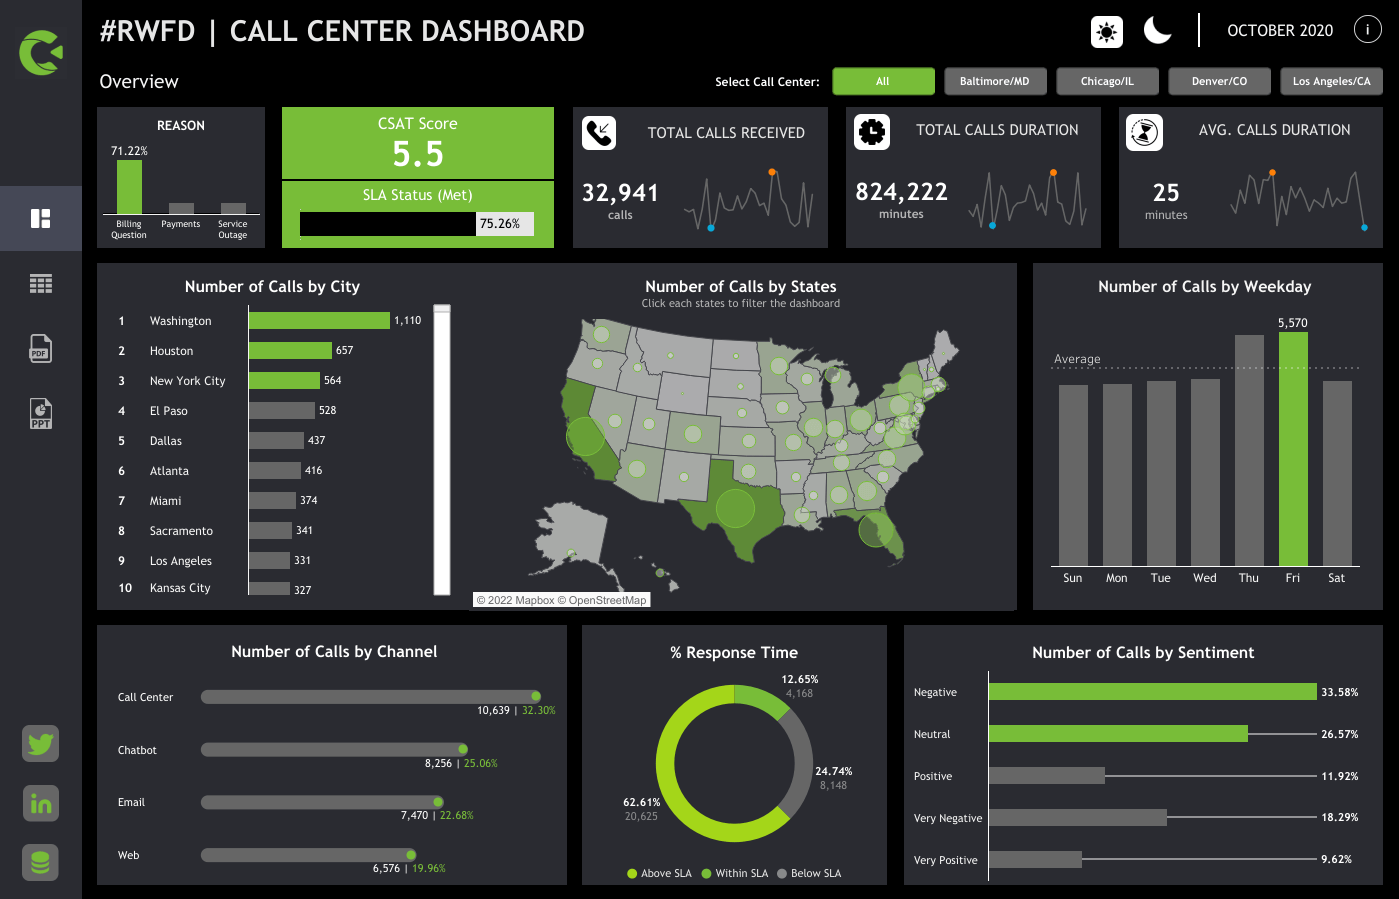
Tableau Accelerator for Call Center (expert)
This dashboard provides visibility into your call center performance. Service leaders can use it to better understand their agents' ability to field incoming calls and get a deep dive into the overall level of service provided to customers.
Call Center Dashboard by Autumn Battani
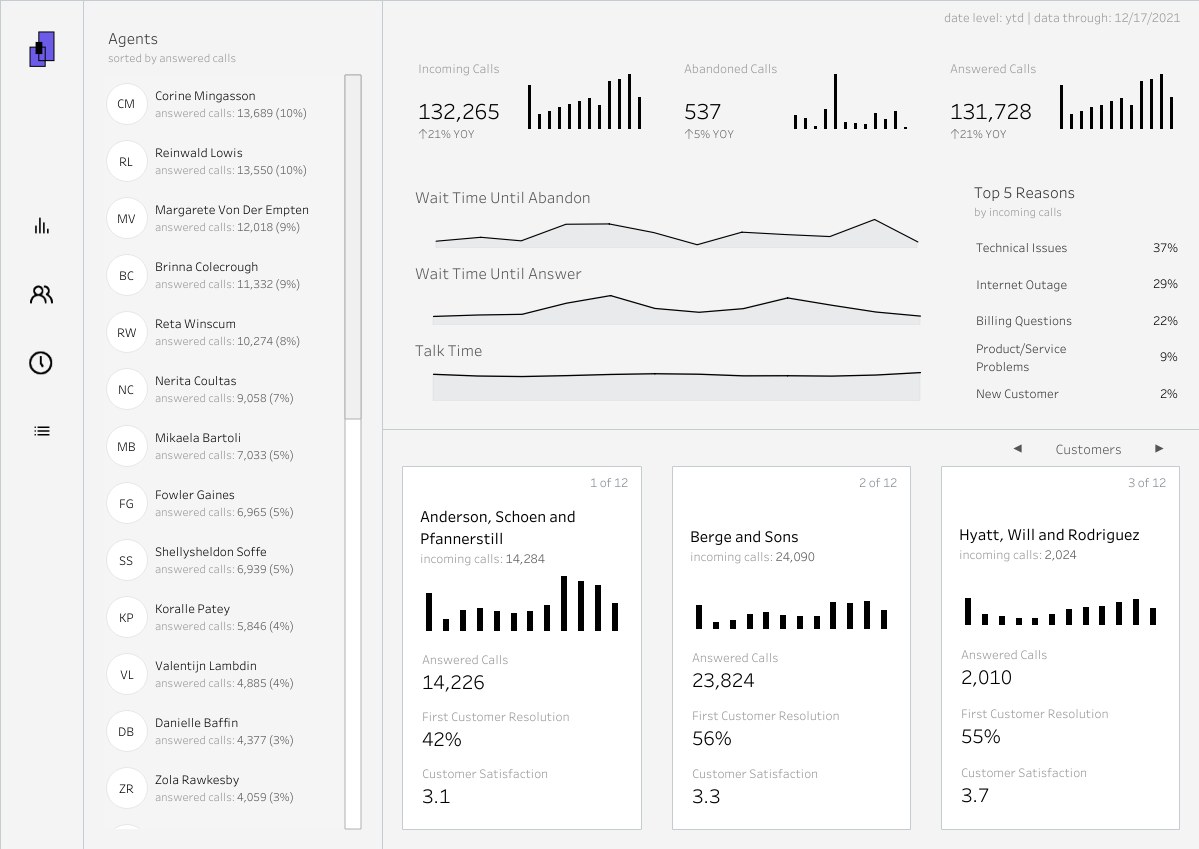
Call Center Dashboard (Light/Dark Mode) by Gandes Goldestan
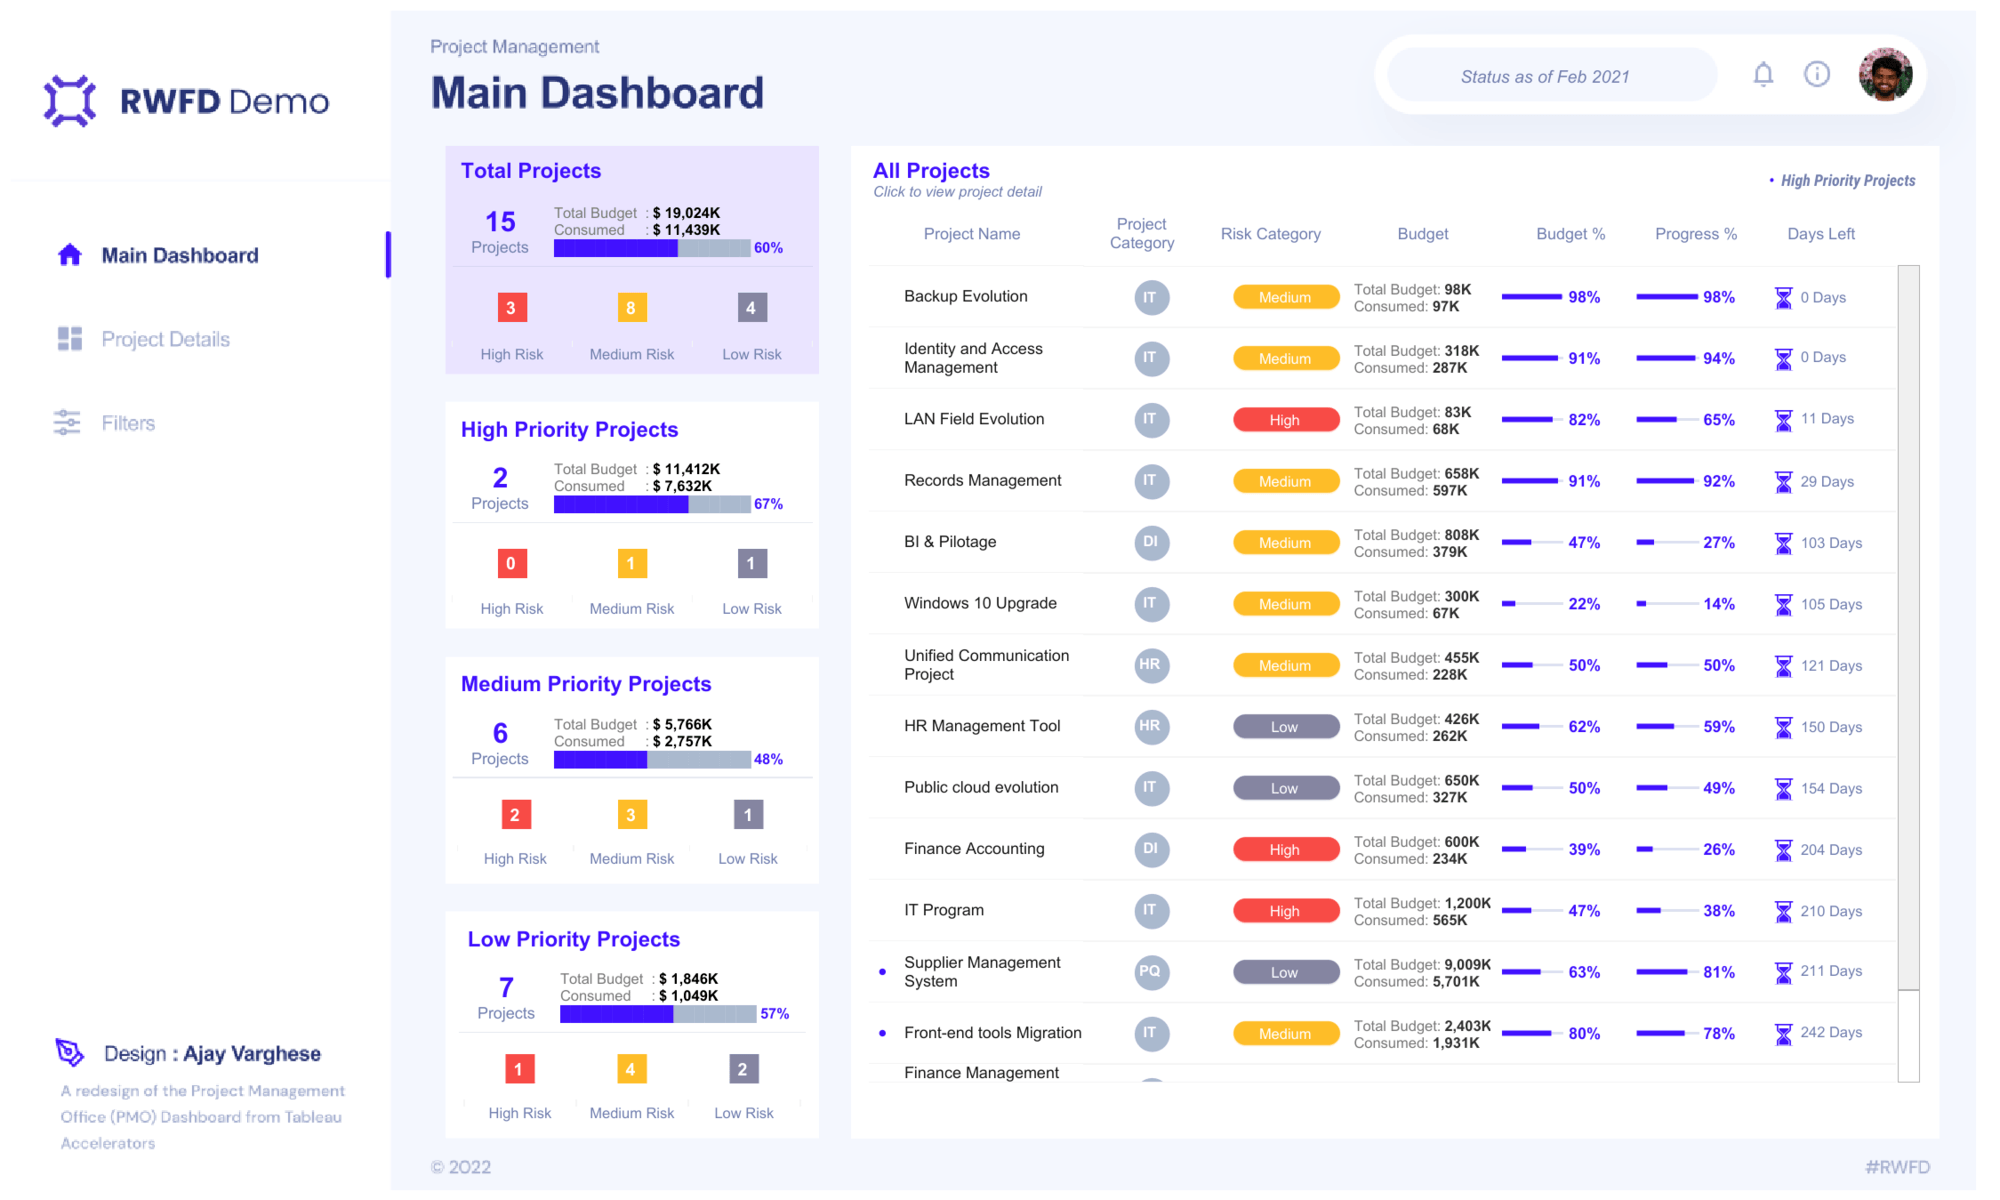
This dashboard provides a clear view on your project portfolio including priority, risks, total budget, consumed budget, and progress.
PMO - Project Management Dashboard by Ajay Varghese
This dashboard provides an overview of a telecommunications network including volume of calls, average setup time, number of cell towers, total handovers, and more.
Telco: Phone and Cell Tower Performance Dashboard by Luke Abraham
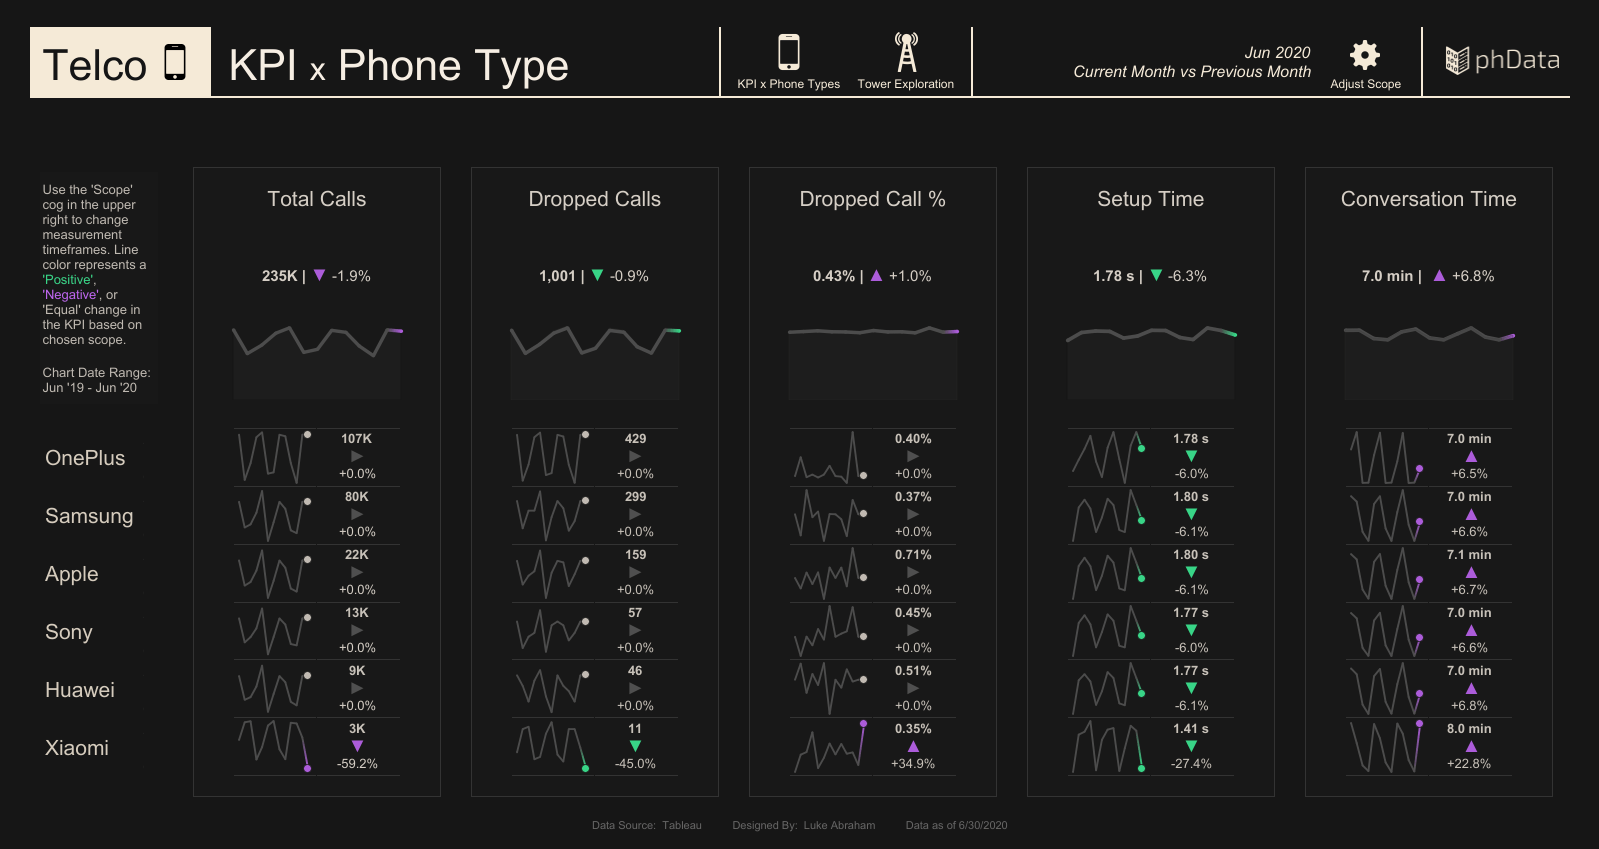
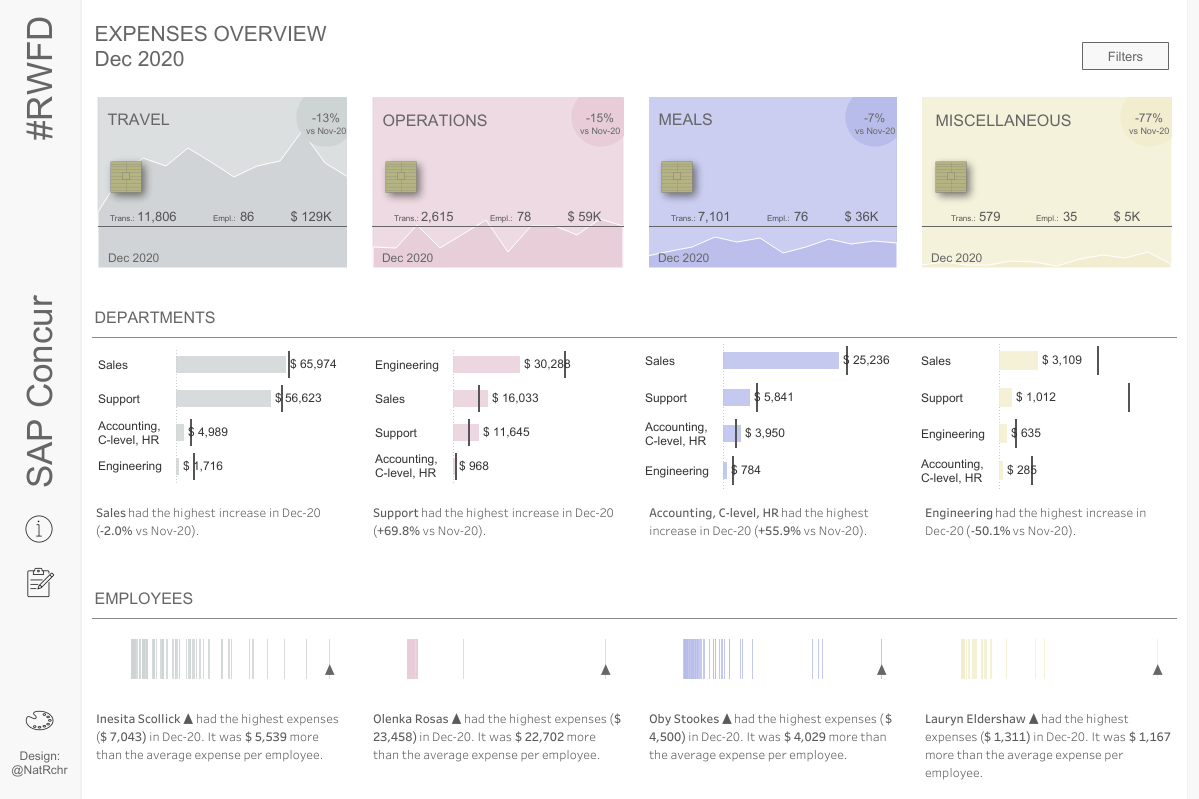
Tableau Accelerator for SAP Concur
This dashboard helps you see and understand your employee expenses and identify ways to save money for your organization.
Visit the Tableau Exchange to jumpstart your data analysis
Excited? Inspired? So are we! Our vision for the Tableau Exchange is for it to extend the power of analytics with apps and expert support for everyone at your company. This integrated hub will fuel a world in which analytics is everywhere—adding Accelerators is just the tip of the iceberg. As you may have seen at Tableau Conference, Datasets will soon be available on the Tableau Exchange.
It’s an epic journey, and we’re glad you’re on it with us. Head to the Tableau Exchange today to try out one of our Accelerators, Connectors, or Dashboard Extensions to answer questions—with actionable data—fast.
関連ストーリー

Extend Access to Embedded Tableau Content with On-Demand Access
 2026/07/22

What is Tableau Prep?
 2026/04/30
あらゆる業務環境でインサイトを取得: Microsoft 365 用の Tableau アプリ登場
 2026/03/16