How to Embed Google Trends Data in a Tableau Dashboard


Let me show you how to marry two data tools, Tableau and Google Trends. Why? Because you might want to quickly check how certain categories in your data have fared in search over time relative to one another.
(Disclaimer: This tutorial will only be valid as long as Google keeps its Google Trends URL scheme the same. I learned the hard way with my Google Maps + Tableau tutorial that you just can’t bank on Google leaving things the same for very long.)
It’s in response to a question posted by Alexandra Samuel on Twitter:
@DataRemixed Down a rabbit hole looking for a @tableau web data connector for google trends/correlate data. Is there an easy option?
— AlexandraSamuel.com (@awsamuel) April 26, 2016
I had given a crack at using Google Trends data in Tableau a year and a half ago with an Ebola scare viz, but it involved a very manual process of downloading the CSV out of Google Trends. Hardly the web data connector experience Alexandra was looking for.
Fellow Tableau geek Eric Peterson did some digging and found out that Google does not have an API for Google Trends:
@awsamuel @DataRemixed @tableau Bummer! Looks like there isn't really a publicly available API: https://t.co/hAsHMiq1ae
— Eric Peterson (@iamEAP) April 27, 2016
End of the road? Are we out of luck if we want to automatically pull search-interest data into Tableau until Google makes an API for Google Trends? Not entirely. Here’s my solution using fast-food survey data. You’ll find a tutorial on how I built it below.

How to Add Google Trends Data to a Tableau Dashboard
The trick to do this involves two key elements:
- The details of the Google Trends URL parameter scheme
- Tableau’s Web Page dashboard object
Step 1: Build a New Sheet
This part was totally straightforward. I created a basic Excel table out of YouGov survey results where respondents said which restaurant had the best burgers and which had the best fries.
Then I dragged “best beef burger” to the Columns shelf and “best fries” to the Rows shelf. I added the fast food logos by dragging “fast food chain” to Shape and making sure I had a folder with the logo PNG files inside my Documents/My Tableau Repository/Shapes folder. Easy. (More on how to use custom shapes here.)

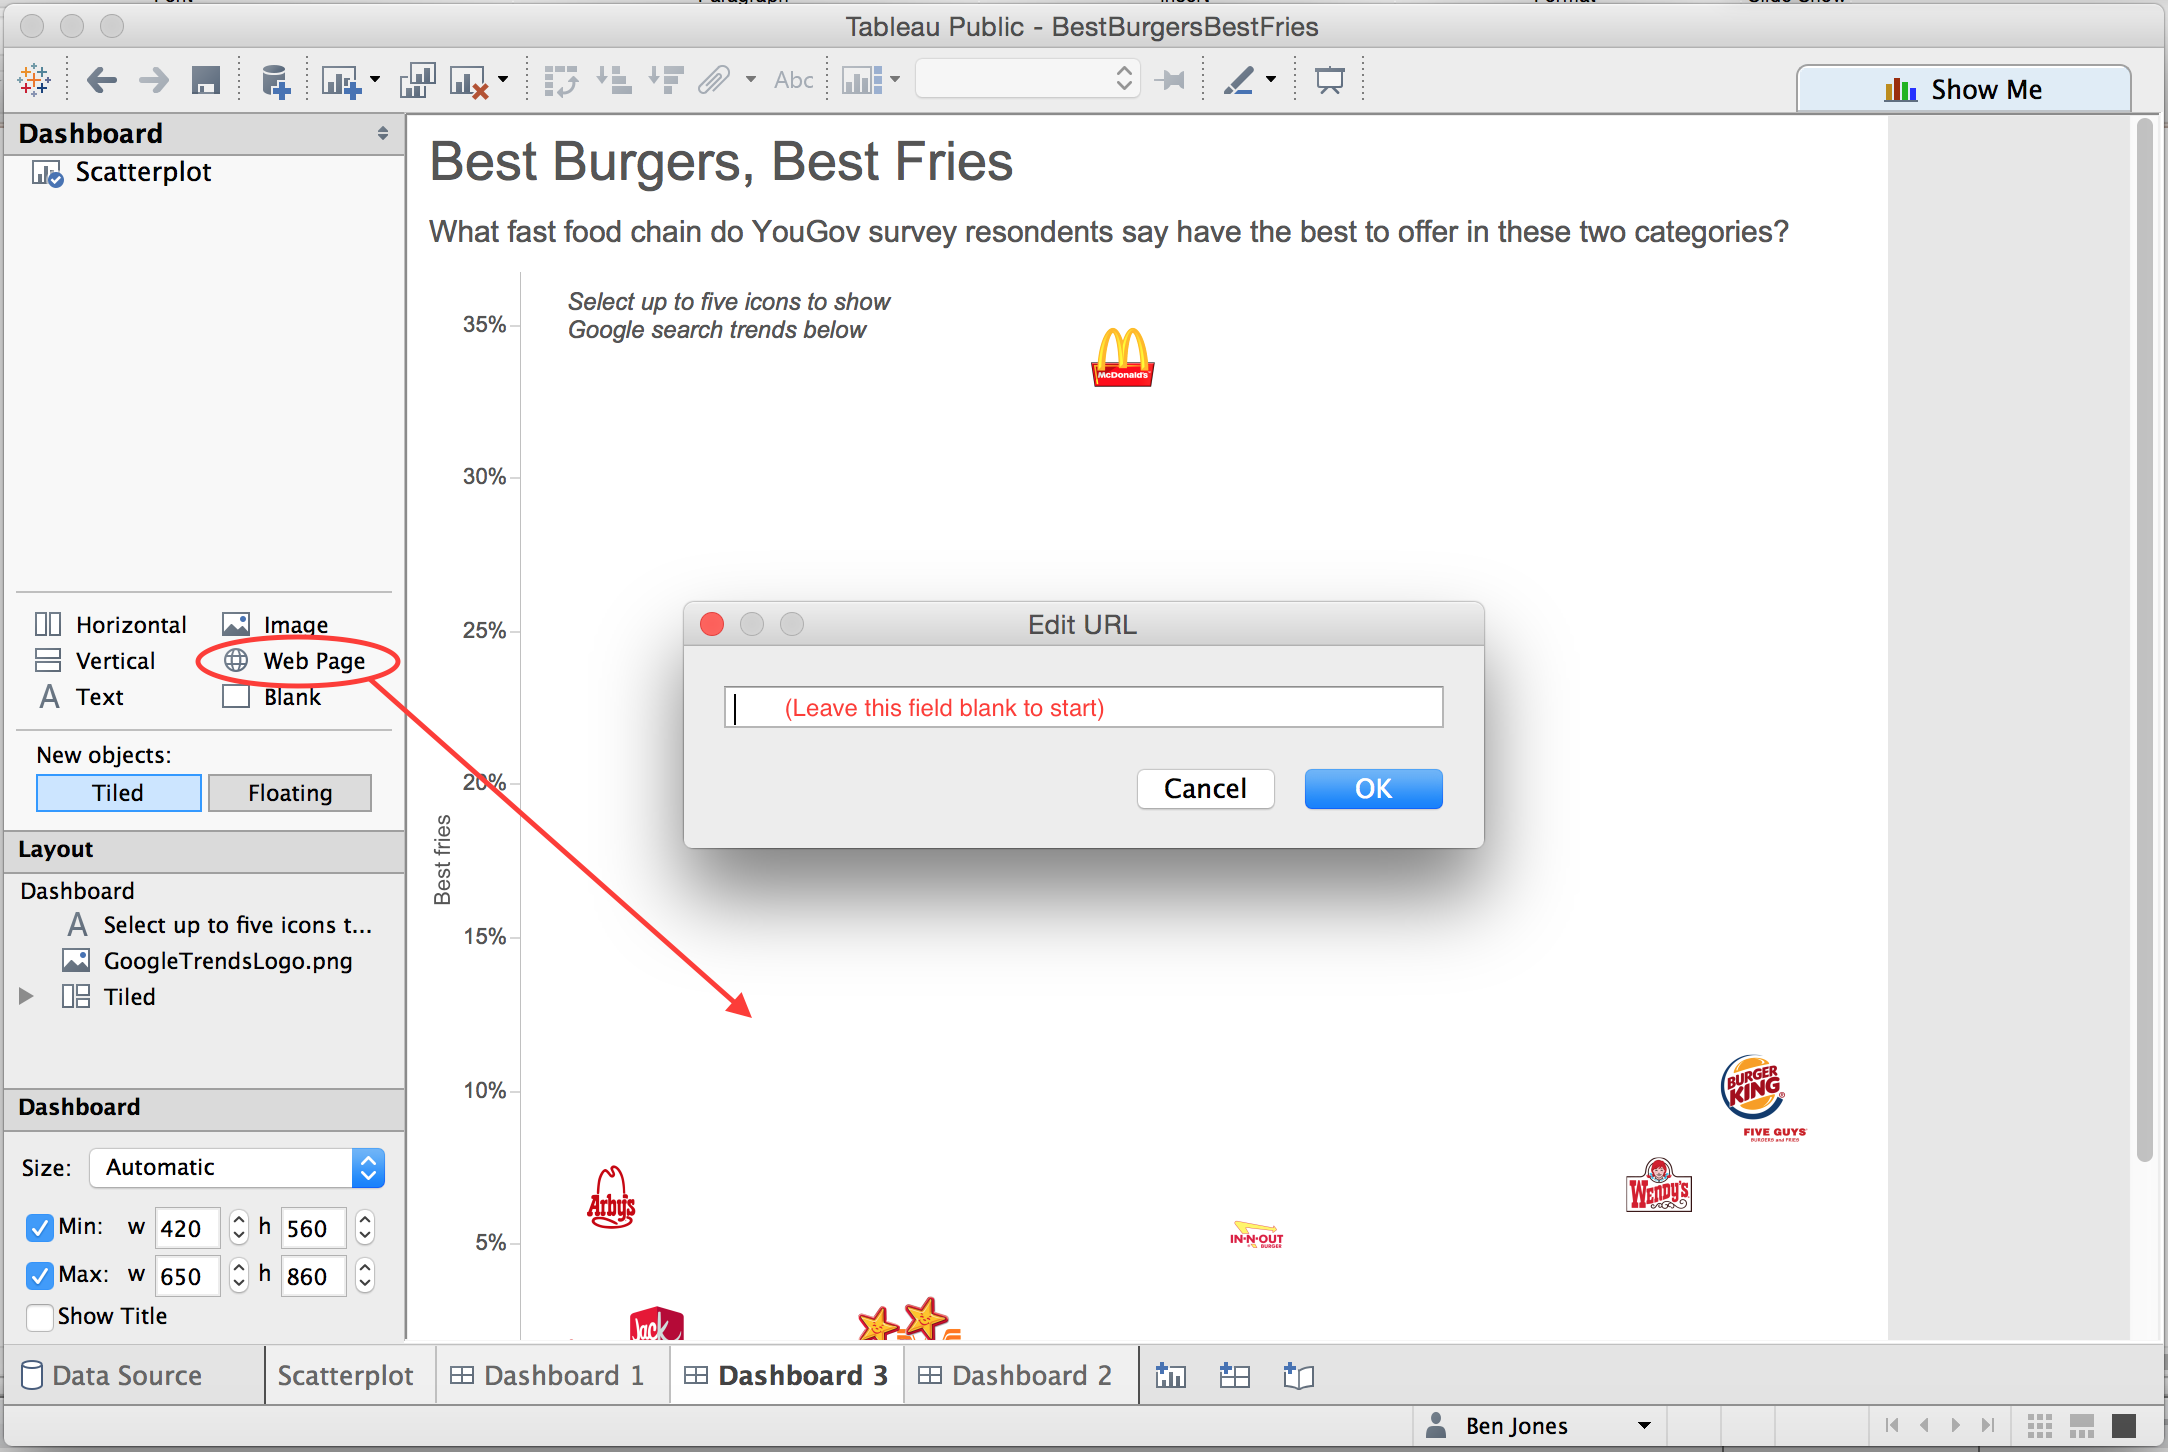
Step 2: Create a New Dashboard and Add a Blank Web Page Object
Once I built my scatter plot, I created a new dashboard, dragging onto it the scatter plot sheet. I dragged over a new Web Page object, and in the resulting dialog box, I left the "Edit URL" field blank.
Step 3: Create a New URL Dashboard Action
Now that the Web Page object is out on the dashboard, I can control which website gets shown inside the box by creating a URL dashboard action. To do so, click Dashboard > Action > Add Action > URL.
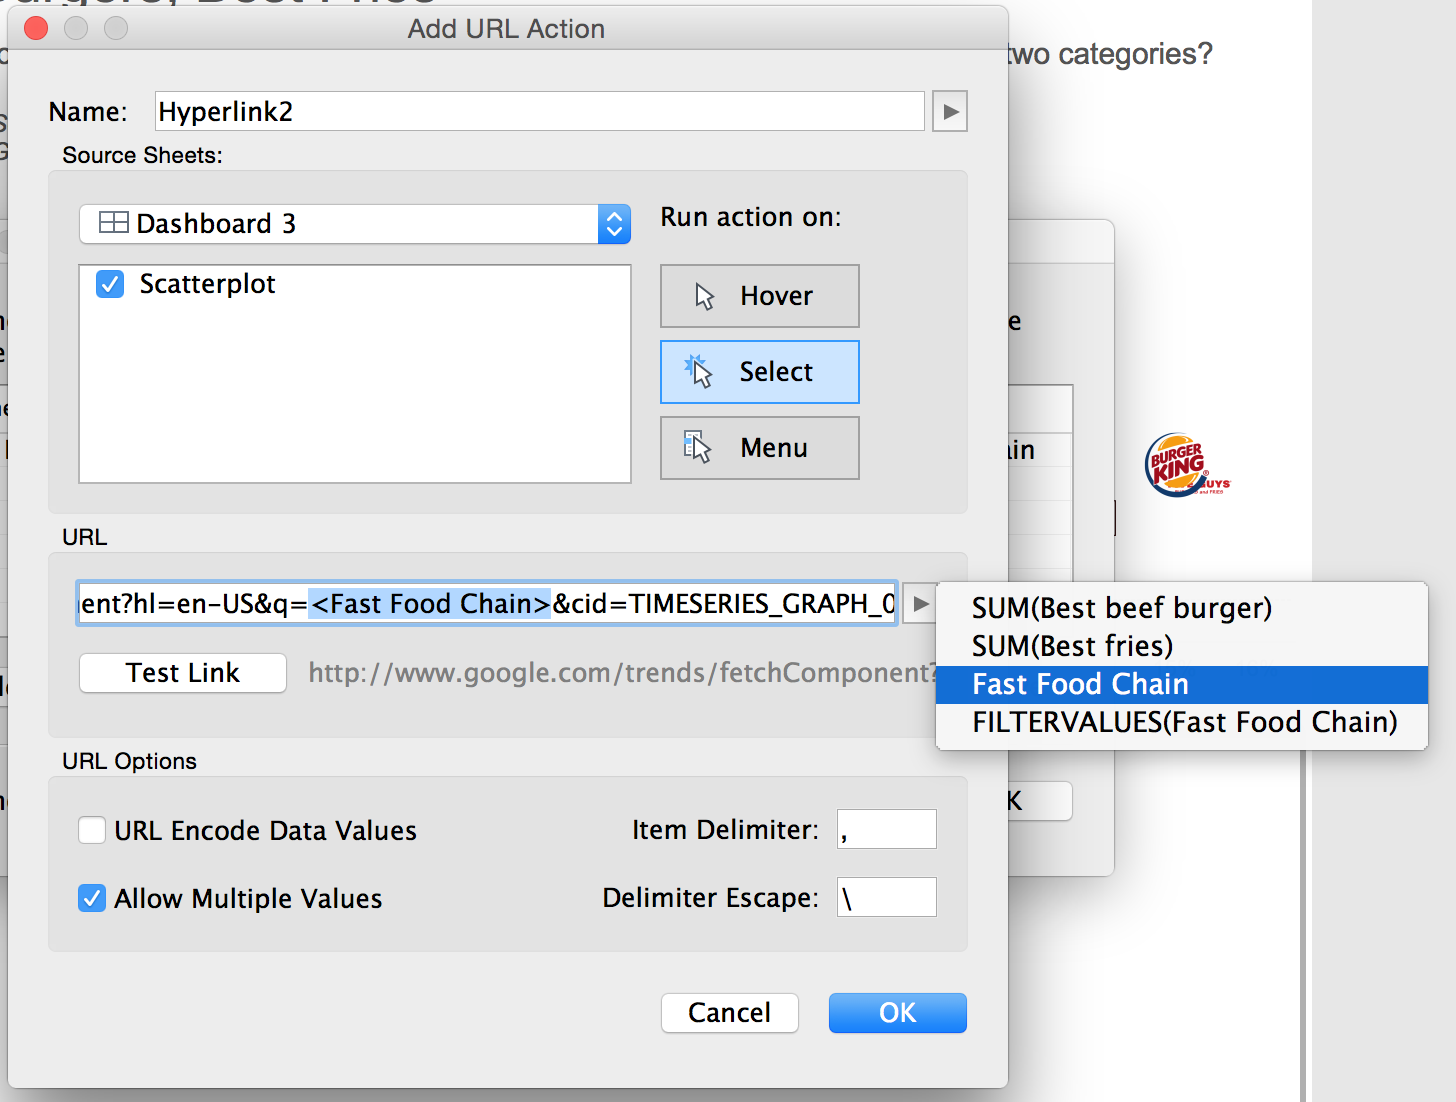
Step 4: Build the Google Trends URL in the URL Action Dialog
The trick is to copy and paste this URL into the "Edit URL" field:
https://www.google.com/trends/fetchComponent?hl=en-US&q=DIMENSION_FIELD_NAME&cid=TIMESERIES_GRAPH_0&export=5&w=500&h=300
And instead of DIMENSION_FIELD_NAME, put the data field that contains the values you want to compare in search interest. In our case, it’s the field "fast food chain" surrounded by angle brackets. Notice that I also changed the URL to run on Select instead of Menu, and I made sure to allow for multiple select by checking the box at the bottom:
That’s it! A word of caution: Google Trends seems to have a search quota, so you might hit your limit like I did when creating this dashboard and trying different things, hitting the trends site from the same IP address over and over. The good news is if you wait a couple hours, you should be good to go again (at least that’s how it was for me).
Obviously this isn’t quite as awesome as accessing the actual raw search trends data itself directly within a Tableau workbook, but I think it’s a pretty good halfway solution. One limitation is that you can’t control the colors of the timelines in the Web Page object, which makes it tough to coordinate your dashboard colors. That’s one reason I used logo images instead of colors to differentiate between the restaurants in the scatter plot.
I think this tip could be taken to a whole different level by embedding Google Trends maps or searching within countries, etc. All you’d need to do is figure out how Google Trends controls these parameters by looking at the URL that it creates when you do a search.
I hope this was helpful to you. Let me know if you find a way to improve on it!
関連ストーリー

VizQL Data Service from Tableau: Use Your Data, Your Way
 2024/08/08

When and How to Use Multi-fact Relationships in Tableau
 2024/08/01

Top data books of 2021
 2021/12/12