DataFam Roundup: February 26–March 1, 2024


Welcome! Dig into this week's DataFam Roundup—a weekly blog that brings together community content all in one post. As always, we invite you to send us your content—and the DataFam content from your peers that have inspired you! Find the content submission form here.
Community Highlight
To recognize new and consistent Tableau contributors—we’re excited to have a section within the weekly DataFam Roundup called the Tableau Community Highlight. Find out how to get involved.

Madeeha Amatur, Data Visualization Enthusiast
Dubai, UAE
Madeeha Amatur is a passionate data enthusiast. She stays active in the Tableau Community by participating in Community Projects, publishing vizzes on Tableau Public, sharing content on X, and answering questions on the Tableau Forums.
As a student pursuing a Masters degree in big data, Madeeha learned about Tableau through research about the data analytics field. She first found Tableau Public and was inspired by the beauty and insight that was being manifested in the visualizations. Wanting to add Tableau to her own tool belt, Madeeha began exploring online tutorials, ‘how-to’ articles, and using trial and error to learn Tableau.
Now, Madeeha is an active participant of many community projects including Back to Viz Basics, Makeover Monday, Iron Quest, Diversity in Data, and Games Night Viz and actively publishes vizzes on Tableau Public. She gains much of her inspiration from seeing vizzes that other creators have made and especially those featured in the Trending section on Tableau Public and Viz of the Day.
Connect with Madeeha on X and Tableau Public.
DataFam content
Dive into content created by the Tableau Community:
-
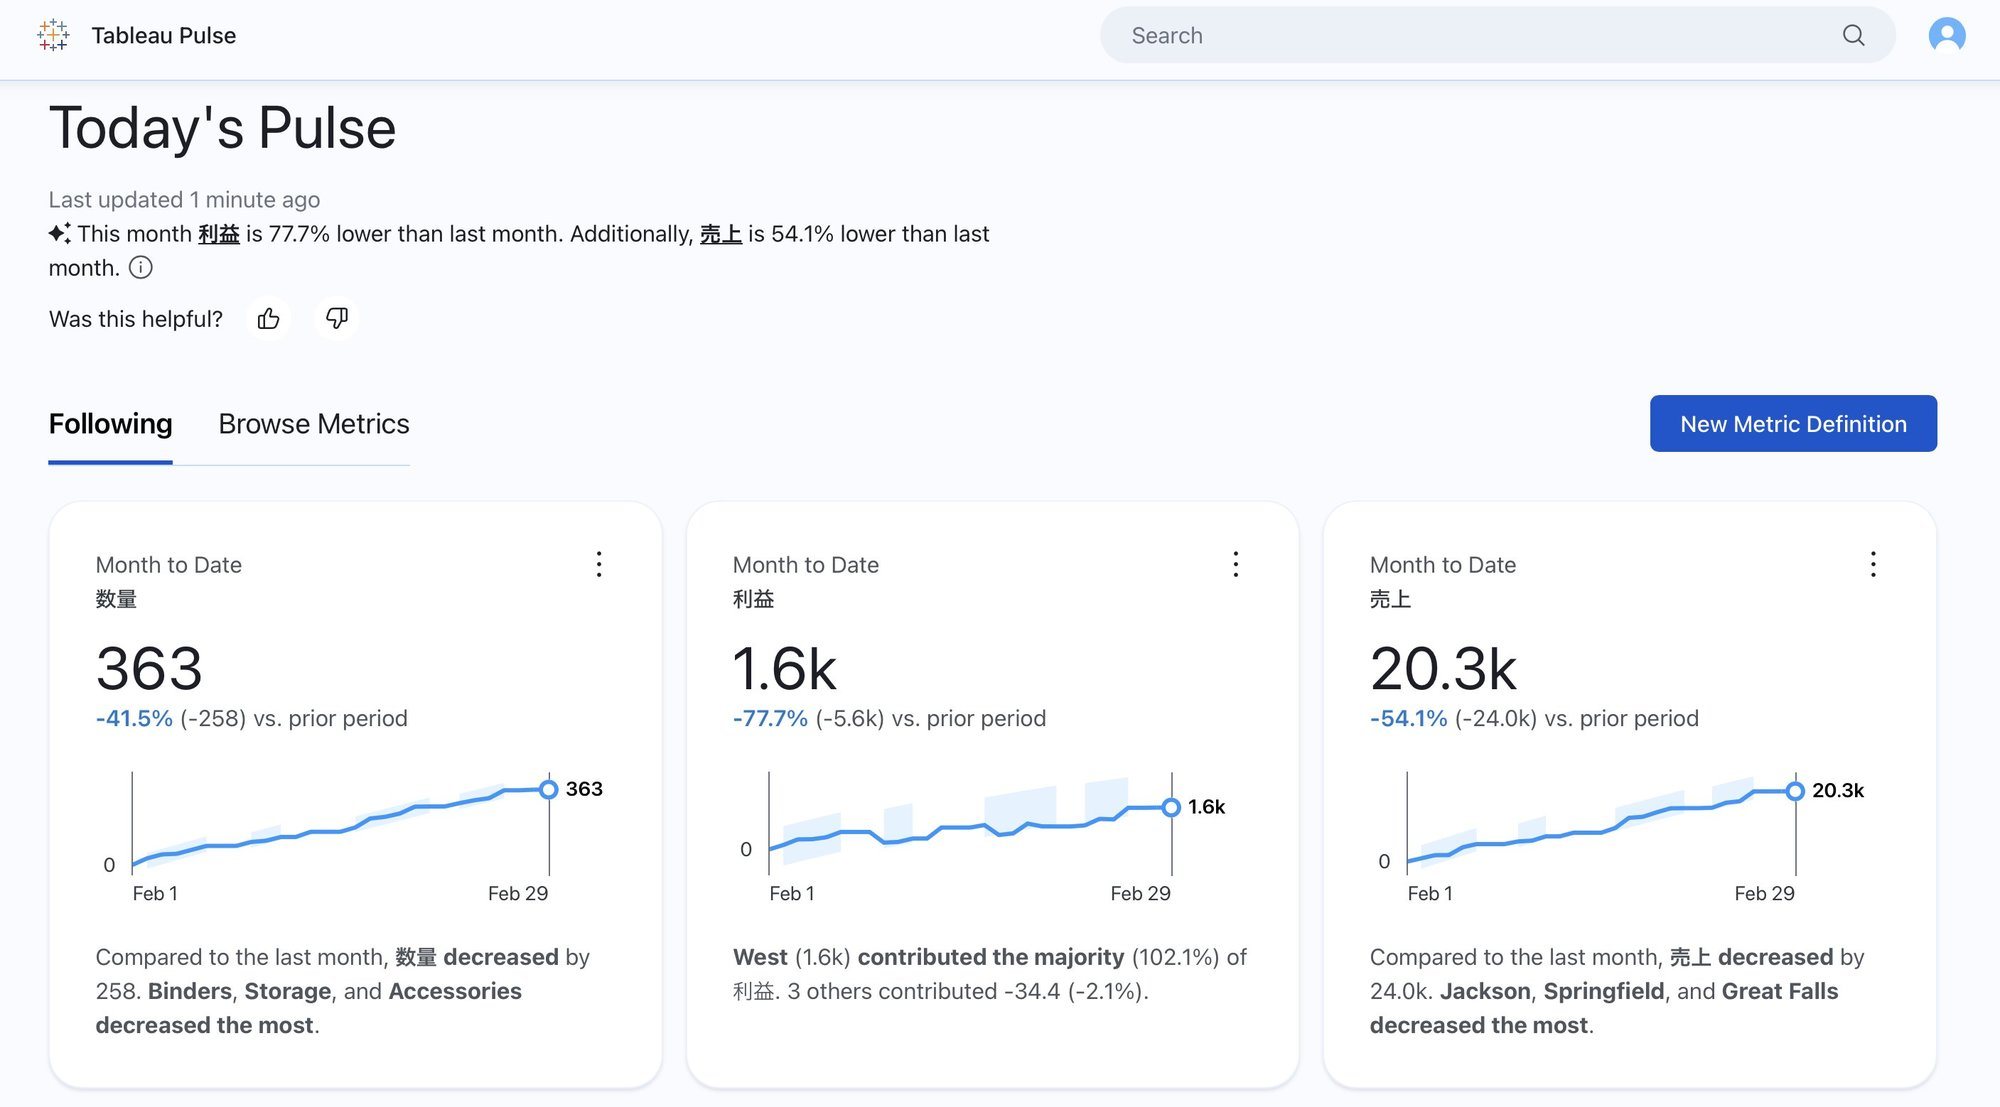
Data Viz Canvas: Tableau pulse -AI powered insights
-
Craig Bloodworth, The Information Lab: Tableau Pulse is here, where does it leave the analyst?
-
Dawn Harrington: How Can I Visually Call Out a Dimension on My Dashboard?
-
Be Data Lit: Career Download: Embracing Neurodiversity: From Retail to FinTech with Lawrence 🌐 | Honest Careers Series
-
Ian Cedric Io: Viz Review: Superstore Sales Dashboard
-
Benny Benford: The Value of Data Governance: Where’s the ROI?
-
Donabel Santos, sqlbelle:
-
Gurpreet Singh, Data Viz Canvas: Tableau pulse -AI powered insights
-
Steve Wood: Transform field per line data with Tableau Prep (1)
-
Tristan Guillevin: Build a Streamgraph in Tableau in one click!
-
Autumn Battani: Leaning Into Your Tableau Learning — Make It Make Sense
-
Ken Flerlage: 9 Ways to Connect to Web-Based CSVs in Tableau
-
Dan Bunker, Playfair Data: An Introduction to Dynamic Zone Visibility in Tableau
-
Donna Coles: Can you create these KPI Cards?
-
Tableau兄さん: My first #TableauPulse
-
Tore Levinsen: #TinyTableauTip
-
Marcelo Has: Tableau Learning Path Trailmix | Salesforce Trailhead
-
Deepak Holla: Understanding the terms Aggregation, Granularity and Level Of Detail and how to relate them when working in Tableau?
Team Tableau
-
Hit the trails with the new Tableau Hands-On Challenges on Trailhead. Get hands-on experience and real-time feedback as you create new vizzes and build your Tableau Public portfolio, for free! To get started, log in or create a Trailhead account and explore one of these 5 new badges:
-
Data Storytelling with Tableau Public - Visualize data on any topic, share your data story worldwide, and get inspired.
-
The Tableau Data Model - Load your dataset and create relationships between tables.
-
Metadata Management in Tableau - Prepare a Tableau dataset with well-managed metadata.
-
Detailed Data Analysis - Ask questions and configure visuals to communicate insights.
-
Data Presentation in Tableau - Build dashboards in Tableau that guide stakeholders through critical analysis.
-
Upcoming events and community participation
-
Data Lead[HER]: Shaping the Future of Data & AI Join us for a virtual event in March, Women's History Month, designed to empower and elevate women leaders in the data and AI space. This program will feature insightful discussions and actionable strategies from women in leadership.
-
Lights, Camera, Action: Tableau and IMDb Launch Data Visualization Campaign for Movie Lovers
-
READY TO SUPERCHARGE YOUR DATA SKILLS? The Information Lab has free, on demand training courses will help you to make sense of your data and take you from zero to data hero. Developed by our industry leading trainers, our expansive courses cover the basics to intermediate levels of Tableau, Alteryx and Tableau Prep! You can take advantage of the whole course or simply choose the modules you need to brush up on your skills. Start your data journey today by simply selecting your training course below.
-
Demystifying the way to learn Data Visualization! Are you looking for a way to learn Data Visualization and feeling lost? We all have been there and I am going to help you understand the fundamentals and look for a way to learn data visualization.
-
Viz Collab: Hello everyone! I’m excited to be opening #VizCollab back up for another round of matches! In the last year I matched around 40 people for some amazing vizzes, including Viz of the Days and a viz that was featured in a local publication. So if you want to find a collaboration partner sign up.
Vizzes
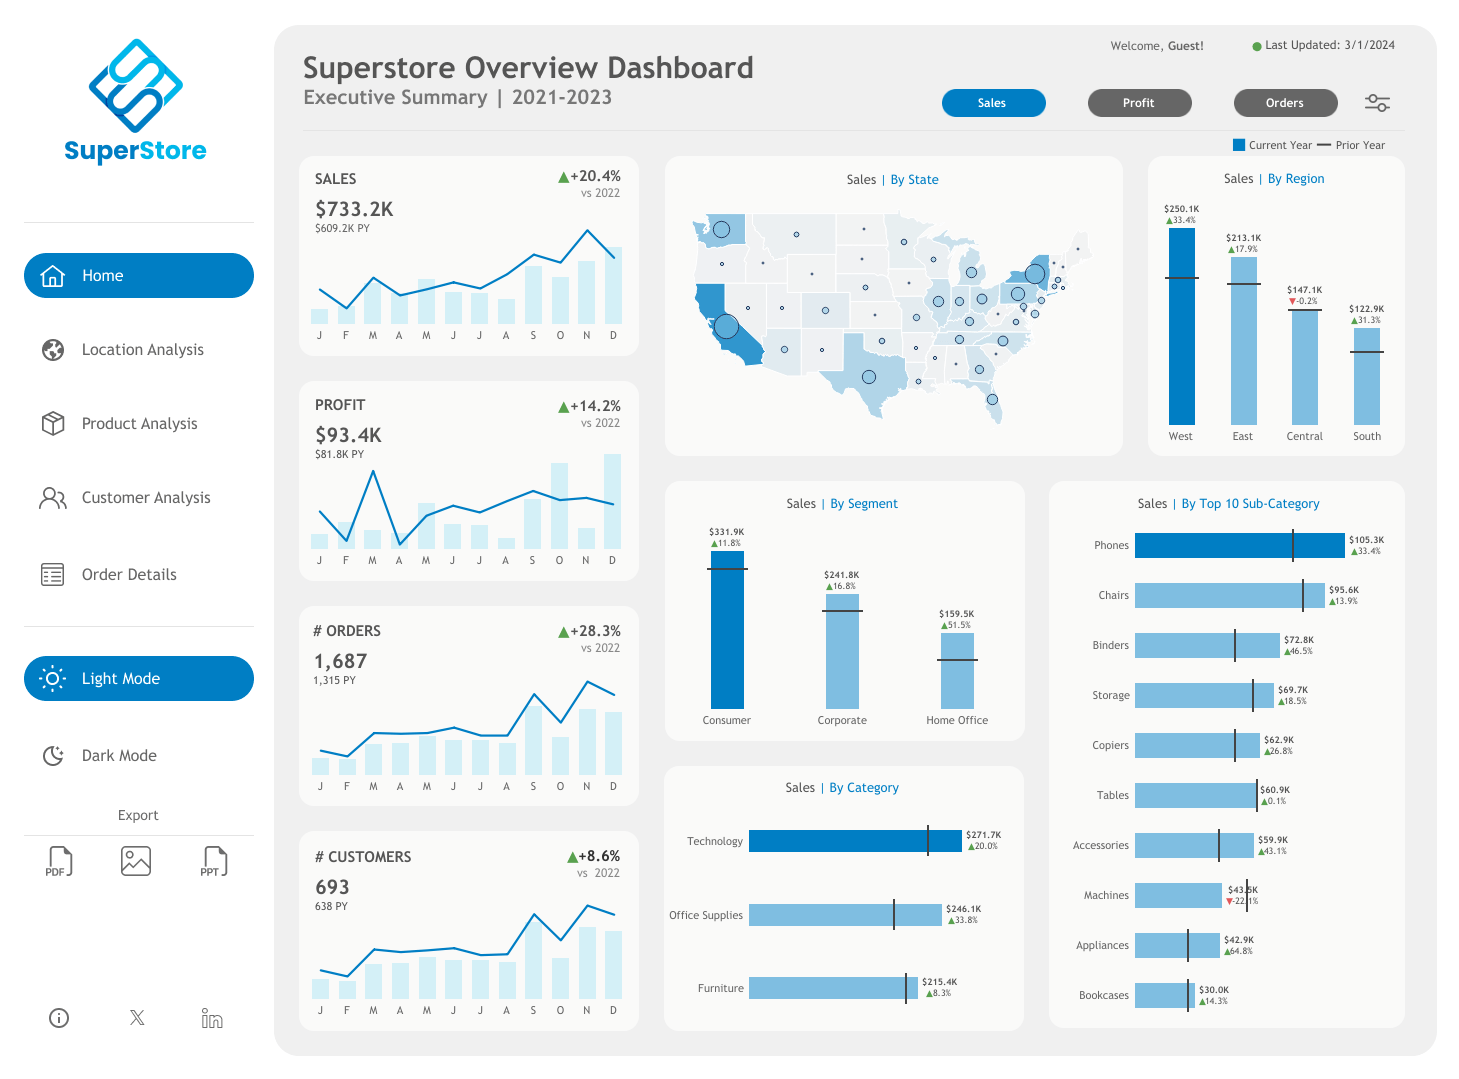
Waqar Ahmed Shaikh: Superstore Overview Dashboard
See the latest Viz of the Day, trending vizzes, featured authors, and more on Tableau Public.
Check out some inspirational vizzes created by the community:
- Deborah Simmons: #WOW2024 Week 8 - Can you create an area chart tile map?
- Annabelle Rincon: Jimmy is Back ! Director cut
- Rosario Gauna: WOW2024 W07 Can you include and exclude options with a custom control?
- YusukeNakanishi: MOM2024W9_67 Best & Worst Countries For Animal Rights
-
Chie Sakaki: 恵方 | Eho (The year's good luck direction)
-
Ray Givler: Customer Service Dynamic Targets
-
Sherzodbek Ibragimov: Most Popular Generative AI Searches in the USA
-
Waqar Ahmed Shaikh: Superstore Overview Dashboard
Community Projects
Recreations of W.E.B Dubois's Data Portraits
Recreations of W.E.B Dubois's Data Portraits
Web: W.E.B. Dubois's Data Portraits
Twitter: #DubiosChallenge
Back 2 Viz Basics
A bi-weekly project helping those who are newer in the community and just starting out with Tableau. Not limited just to newbies!
Web: Back 2 Viz Basics
Twitter: #B2VB
Week 4: Build a Bar Chart
Workout Wednesday
Build your skills with a weekly challenge to re-create an interactive data visualization.
Web: Workout Wednesday
Twitter: #WOW2022
Week 9: Can you create these KPI Cards?
Preppin' Data
A weekly challenge to help you learn to prepare data and use Tableau Prep.
Web: Preppin’ Data
Twitter: #PreppinData
Week 9: Prep Air Capacity
DataFam Con
A monthly challenge covering pop culture and fandoms.
Web: DataFam Con
Twitter: #DataFamCon
March 2024 Challenge: Sports Movies Edition
Makeover Monday
Create business dashboards using provided data sets for various industries and departments.
Web: Makeover Monday
Twitter: #MakeoverMonday
Week 9: 67 Best & Worst Countries For Animal Rights
EduVizzers
A monthly project connecting real education data with real people.
Web: Eduvizzers
February 2024: SPP compared to SPS Kindergarteners | City of Seattle Open Data Portal
Games Night Viz
A monthly project focusing on using data from your favorite games.
Web: Games Nights Viz
Twitter: #GamesNightViz
Season 2: With great power comes great vizzes
Iron Quest
Practice data sourcing, preparation, and visualization skills in a themed monthly challenge.
Web: Iron Quest
Twitter: #IronQuest
White Space
Storytelling with Data
Practice data visualization and storytelling skills by participating in monthly challenges and exercises.
Web: Storytelling with Data
Twitter: #SWDChallenge
February 2024: design for accessibility
Project Health Viz
Uncover new stories by visualizing healthcare data sets provided each month.
Web: Project Health Viz
Twitter: #ProjectHealthViz
October 2023: Customizing Shapes with Opacity in Tableau
Diversity in Data
An initiative centered around diversity, equity & awareness by visualizing provided datasets each month.
Web: Diversity in Data
Twitter: #DiversityinData
November 2023: Disney Demographics
Sports Viz Sunday
Create and share data visualizations using rich, sports-themed data sets in a monthly challenge.
Web: Sports Viz Sunday
Twitter: #SportsVizSunday
Viz for Social Good
Volunteer to design data visualizations that help nonprofits harness the power of data for social change.
Web: Viz for Social Good
Twitter: #VizforSocialGood
Real World Fake Data
Create business dashboards using provided data sets for various industries and departments.
Web: Real World Fake Data
Twitter: #RWFD
Session 6: HR Cross-Function Mobility
Data Plus Music
A monthly project visualizing the data behind the music we love!
Web: Data Plus Music
Twitter: #DataPlusMusic
関連ストーリー

DataFam Roundup June 2026

DataFam Roundup May 2026

Iron Viz 2026: Read Between the Data
 2026/05/28