DataFam Roundup: August 21–25, 2023


Welcome! Dig into this week's DataFam Roundup—a weekly blog that brings together community content all in one post. As always, we invite you to send us your content—and the DataFam content from your peers that have inspired you! Find the content submission form here.
Community Highlight
To recognize new and consistent Tableau contributors—we’re excited to have a section within the weekly DataFam Roundup called the Tableau Community Highlight. Find out how to get involved.

Gbóláhàn Adébáyò, Data Visualization Developer at MAGNiTT
Lagos, Nigeria
Gbóláhàn Adébáyò is a Data Visualization Developer at MAGNiTT. When completing his first Data Analytics certification, Gbóláhàn stumbled upon Tableau Public and was inspired by the amount of amazing content that was available. Following that, he began taking courses focused on Tableau to understand the tool and how it could be used as a business intelligence tool, however found that connecting with the community was far more valuable to his learning journey. Gbóláhàn is now involved in community projects, several Tableau User Groups, and the community forums, and publishes content on Tableau Public. He was also chosen as the winner of the “Newbie of the Year” Vizzies award at Tableau Conference 2023.
Along with his involvement in the Tableau community, Gbóláhàn is working to get more people involved in the Tableau Community. He volunteers with several data analytics and visualization cohort programs for women trying to enter the data analytics space. He also uses social media platforms, such as Linkedin and X, and the Tableau Community Forums to answer questions and engage with people looking to improve their Tableau skills.
Gbóláhàn aims to get more people from the Nigerian community involved in User Groups and community projects, and be a reference point for the #DataFam in Nigeria by keeping them motivated and finding ways to amplify opportunities in the Tableau community.
Connect with Gbóláhàn on Linkedin, X, and Tableau Public.
DataFam content
Dive into content created by the Tableau Community:
-
Kateřina Protivenskiy: Choosing the Right Visualisation: Line vs. Area Chart (Stacked/Unstacked)
-
Deepak Holla: Tableau Key Terms 101
-
Action Analytics:
-
Andy Kriebel, VizWiz: #B2VB - 2022/W4 - Design Some KPIs
-
Zach Bowders, Data+Love: Tableau CEO Ryan Aytay drops in to talk Tableau Conference '24, Dreamforce, AI, and more
-
Valerie Logan, The Data Leadership Collaborative: The Three Key Data Literacy Personas
-
Mimi Li, The Data Leadership Collaborative: How Career Sponsors Can Build the Next Generation of Data Leaders
-
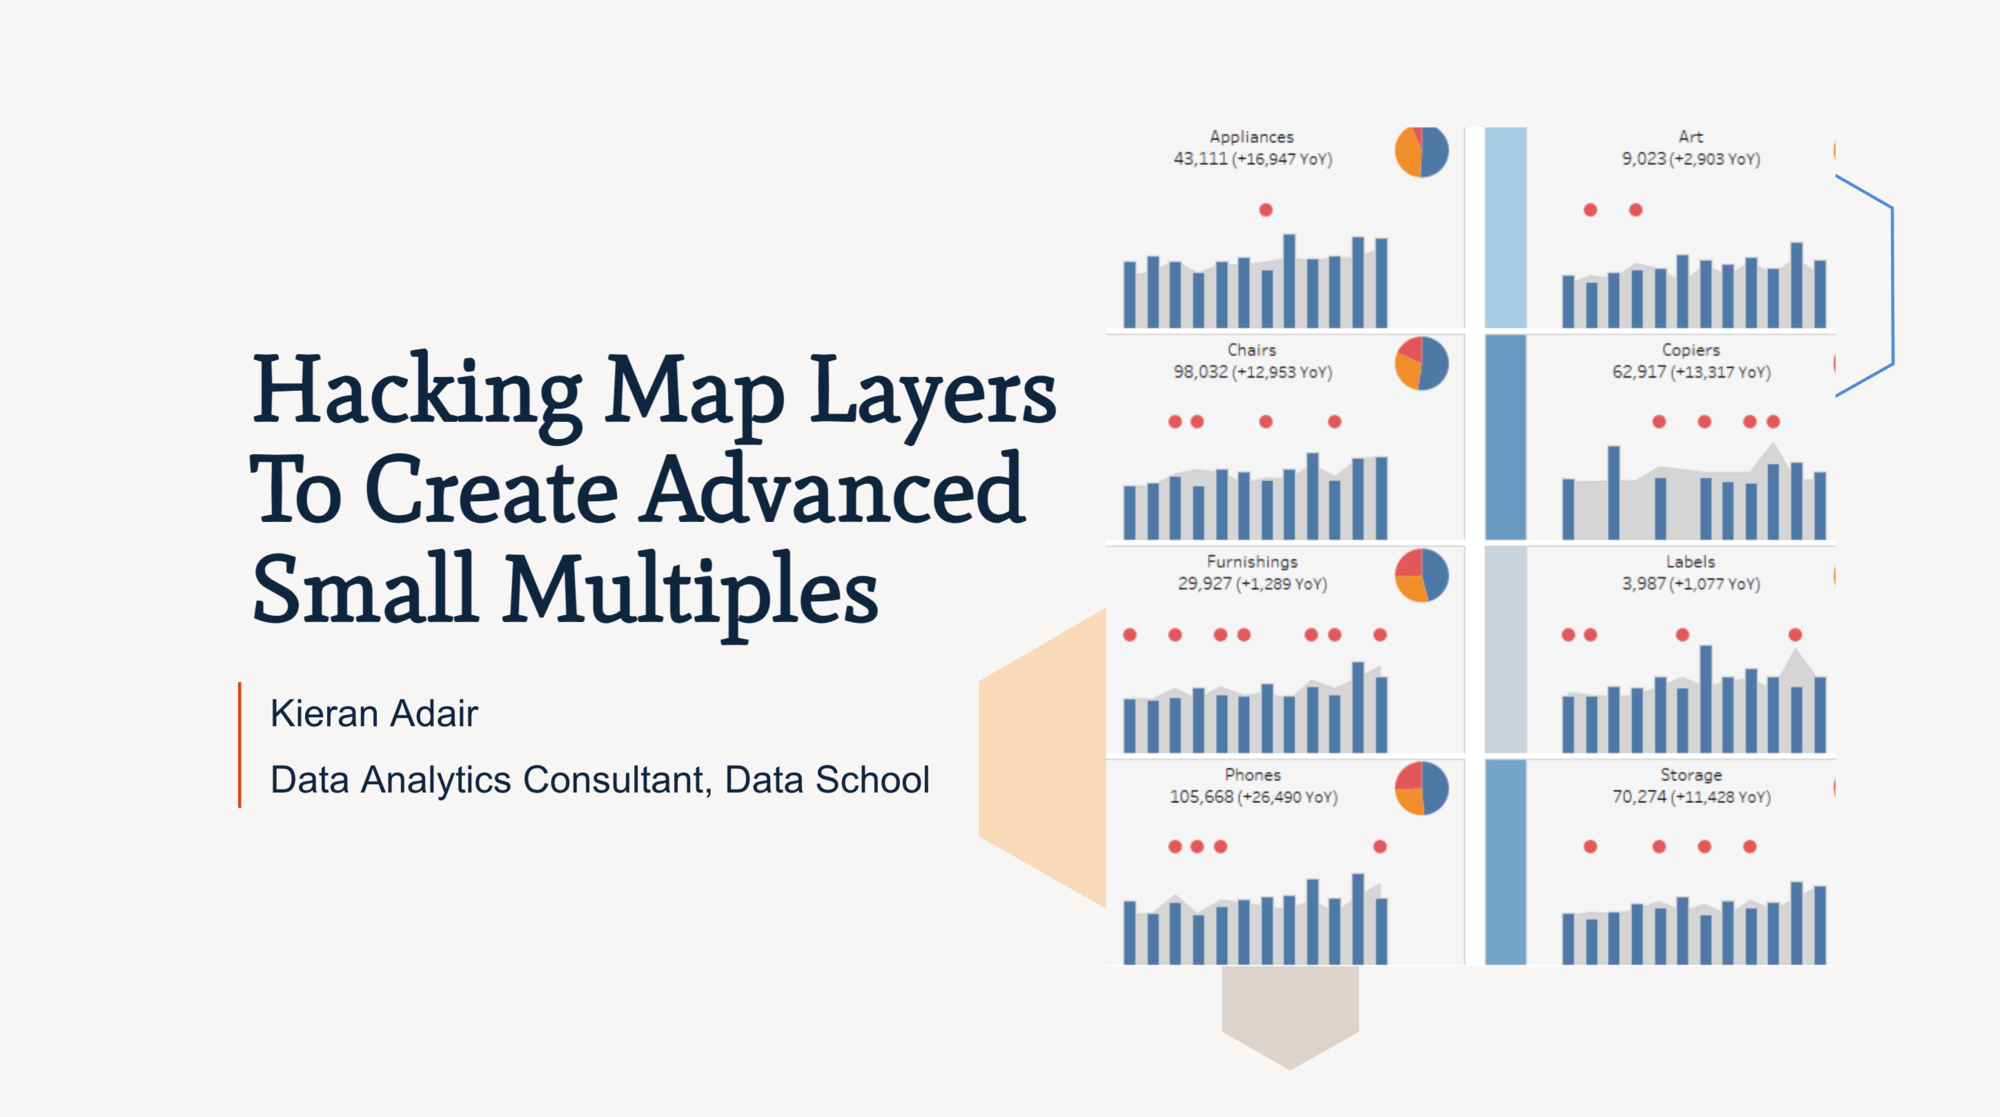
Kieran Adair, Hacking Map Layers
-
Will Sutton: Inbox Insights: Decoding Email Campaigns in Tableau with Serena Purslow
Team Tableau
Staying connected with the DataFam just got a whole lot easier! Log in to your Tableau Public account and explore the Recent Activity channel to find the latest updates from your network. With the Recent Activity channel you can:
- View recently published vizzes from the authors you follow
- Find recently favorited vizzes from authors in your network
- Discover new authors who inspire you
The more authors you follow, the more content you’ll see!
Upcoming events and community participation
-
Demystifying the way to learn Data Visualization! Are you looking for a way to learn Data Visualization and feeling lost?We all have been there and I am going to help you understand the fundamentals and look for a way to learn data visualization.
-
Career Pathmakers: This is the launch event for the Career PathMakers user group. This group will be focused on helping its members navigate challenges in their careers, both with a mentorship program and a transition support program.
-
Tableau Buddy for students and data aspirants (FREE) with Prasann Prem
-
Viz Collab is back: Hello everyone! I’m excited to be opening #VizCollab back up for another round of matches! In the last year I matched around 40 people for some amazing vizzes, including Viz of the Days and a viz that was featured in a local publication. So if you want to find a collaboration partner sign up.
-
VizIt Sydney is happening October 31 - November 1! A Tableau Community Conference, by the Datafam for the Datafam. Sign up to be the first to know when registration opens and submit to be a speaker now
-
Michelle Frayman, Zak Geis and Nicole Klassen: Viz Feedback Office Hours
-
Data Book Club: This summer, the Data Book Club is reading Living in Data: A Citizen's Guide to a Better Information Future by Jer Thorp.
-
Community Calendar and Upcoming Events: stay up-to-date on the latest Women in Dataviz events and other data visualization-related events. If you'd like to submit an event to the calendar, please fill out this form.
Vizzes
Katerina Protivenskiy: 3 types of Gauge charts
See the latest Viz of the Day, trending vizzes, featured authors, and more on Tableau Public.
Check out some inspirational vizzes created by the community:
-
Rob Taylor: Drop Down Filters Template
-
Kristina Sementkovskaia: #VizforSocialGood - Cepei
-
Oreoluwa Folorunsho: The Impact of HIV on Adolescents Africans|Afro-Tech Girls Project
-
Sumeet Badgujar: Superstore Sales Performance Dashboard
-
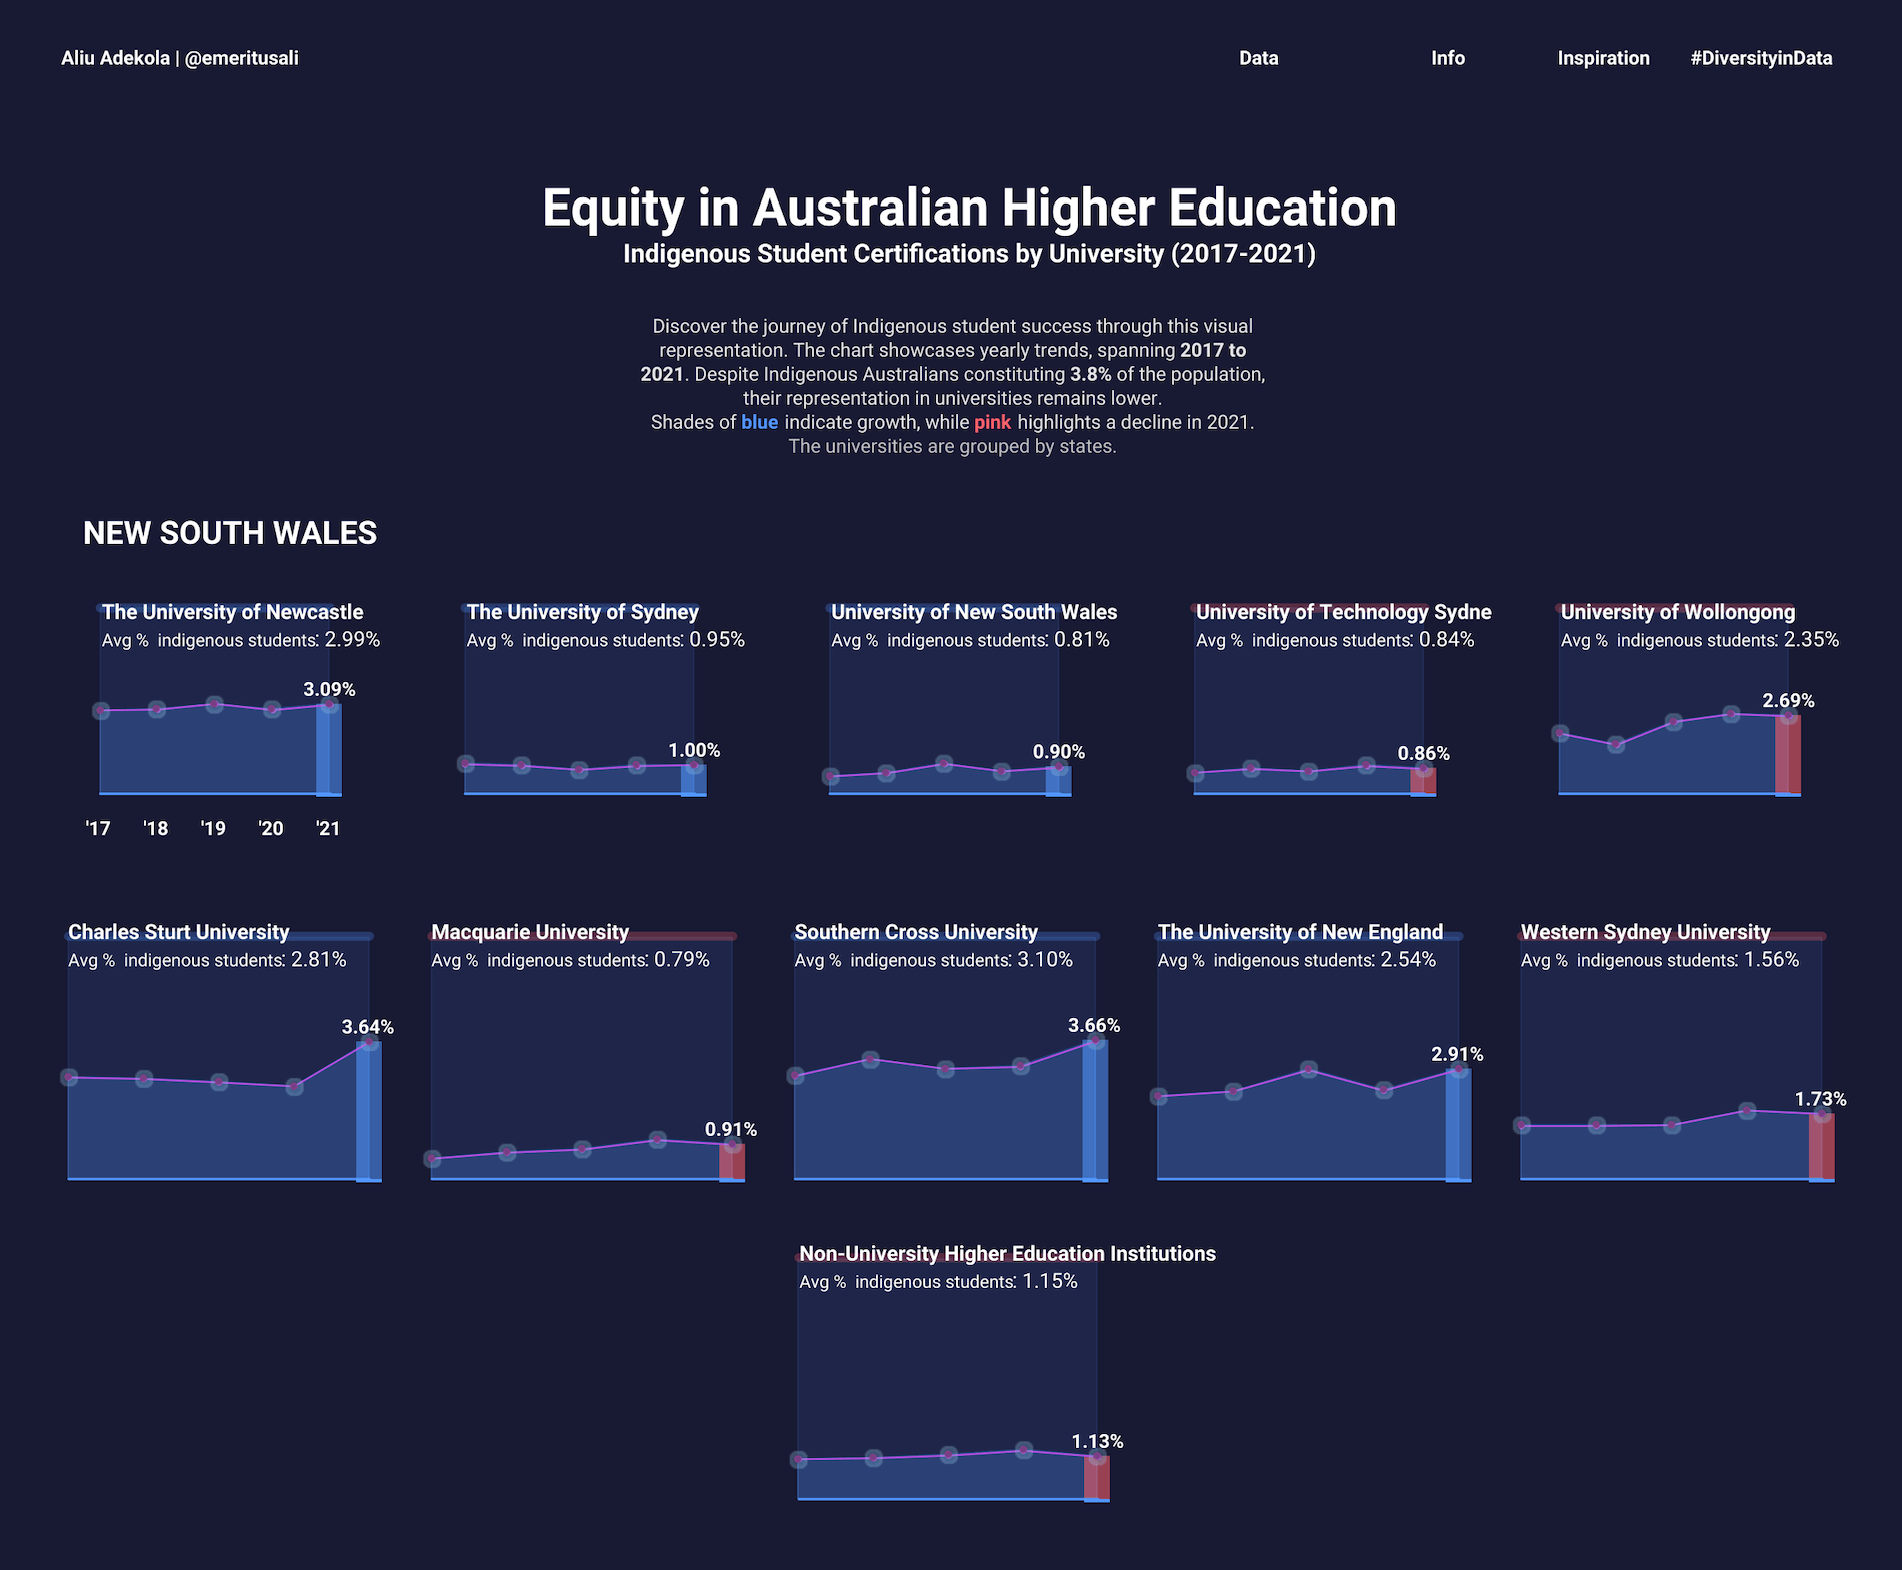
Aliu Adekola, Equity In Australian Higher Education
Community Projects
Back 2 Viz Basics
A bi-weekly project helping those who are newer in the community and just starting out with Tableau. Not limited just to newbies!
Web: Back 2 Viz Basics
Twitter: #B2VB
Week 16: Percent Change
Workout Wednesday
Build your skills with a weekly challenge to re-create an interactive data visualization.
Web: Workout Wednesday
Twitter: #WOW2022
Week 34: User Experience, Design & Templates
Makeover Monday
A weekly social data project.
Web: Makeover Monday
Twitter: #MakeoverMonday
Week 34: Drinking & Dating
Preppin' Data
A weekly challenge to help you learn to prepare data and use Tableau Prep.
Web: Preppin’ Data
Twitter: #PreppinData
Week 33: HR Month - Turnover Rate
DataFam Con
A monthly challenge covering pop culture and fandoms.
Web: DataFam Con
Twitter: #DataFamCon
April 2023: Kids Month!
EduVizzers
A monthly project connecting real education data with real people.
Web: Eduvizzers
August 2023: Data Analytics Programs in the U.S.
Games Night Viz
A monthly project focusing on using data from your favorite games.
Web: Games Nights Viz
Twitter: #GamesNightViz
Season 2: Exploding Hungry Pie-Charts
Iron Quest
Practice data sourcing, preparation, and visualization skills in a themed monthly challenge.
Web: Iron Quest
Twitter: #IronQuest
Advanced Chart Types
Storytelling with Data
Practice data visualization and storytelling skills by participating in monthly challenges and exercises.
Web: Storytelling with Data
Twitter: #SWDChallenge
August 2023: what does your audience know?
Project Health Viz
Uncover new stories by visualizing healthcare data sets provided each month.
Web: Project Health Viz
Twitter: #ProjectHealthViz
June 2023: Funding for Research for Various Conditions and Diseases
Diversity in Data
An initiative centered around diversity, equity & awareness by visualizing provided datasets each month.
Web: Diversity in Data
Twitter: #DiversityinData
May 2023: Mental Health Awareness Month and LGBTQ+ Representation in film
Sports Viz Sunday
Create and share data visualizations using rich, sports-themed data sets in a monthly challenge.
Web: Sports Viz Sunday
Twitter: #SportsVizSunday
January 2023: Is it a Sport or a Game?
Viz for Social Good
Volunteer to design data visualizations that help nonprofits harness the power of data for social change.
Web: Viz for Social Good
Twitter: #VizforSocialGood
June 9 - July 18, 2023: Gord Downie & Chanie Wenjack Fund
Real World Fake Data
Create business dashboards using provided data sets for various industries and departments.
Web: Real World Fake Data
Twitter: #RWFD
Session 5: Diversity Score Card
Data Plus Music
A monthly project visualizing the data behind the music we love!
Web: Data Plus Music
Twitter: #DataPlusMusic
関連ストーリー

DataFam Roundup June 2026

DataFam Roundup May 2026