#Data15 Keynote: The Annual Tent Revival of the Analytics World


Today’s it! The day when the community of data-curious and analytics-loving get together in a big room to get amped up for new Tableau features.
The Tableau Conference 2015 keynote kicked off with Christian Chabot, Tableau CEO, who told us about the impact that data can have. He talked about customers who are using data to improve the process of making steel, of understanding the migration of manta rays, of improving social care for foster children.

Then Francois Ajenstat of the Product Management team came on and talked about the beliefs that drive the development team:
- That we must make software that is simple, approachable, and fun.
- That we can design for deeper thinking to help augment human intelligence.
- That analytics can transform our workplaces and drive change.
Then Francois introduced the developers who would show off the innovation built from those beliefs.
It’s the truth of analytics that some data must come before it. Roger Hau, product manager, came on stage to talk about features that help people work with data.
The Data Interpreter now has a Frame Finder. This lets you work with Excel files that have data in different regions on the sheet.
Yuck. Now, fixable.
Date recognition has improved. New data parse features let you recognize dates more easily, so you can use date-time data in analysis.
The hero of this section, however, was Union. Data geeks, like anyone, love it when things come together. And with the Union feature, you can now combine two data sources to make one. Roger’s example was data from New York City that separated different neighborhoods into different files. Union the files, and you have a complete data set for NYC!
Finally, Roger showed some early work on cross database joins.

Viz! Maps! Map Data!
Amy Forstrom had to contain her enthusiasm as she demoed a host of new visualization and maps features: first, better highlight tables that show the range in your data.
Amy also showed the ability to move Grand Totals to the top of the data instead of at the bottom. Bam! That one has 537 votes in the Ideas Community as of today.
Finally in analytics, she introduced a new tool: the new Data Highlighter that lets you search, highlight (not filter!), and compare your data in context.
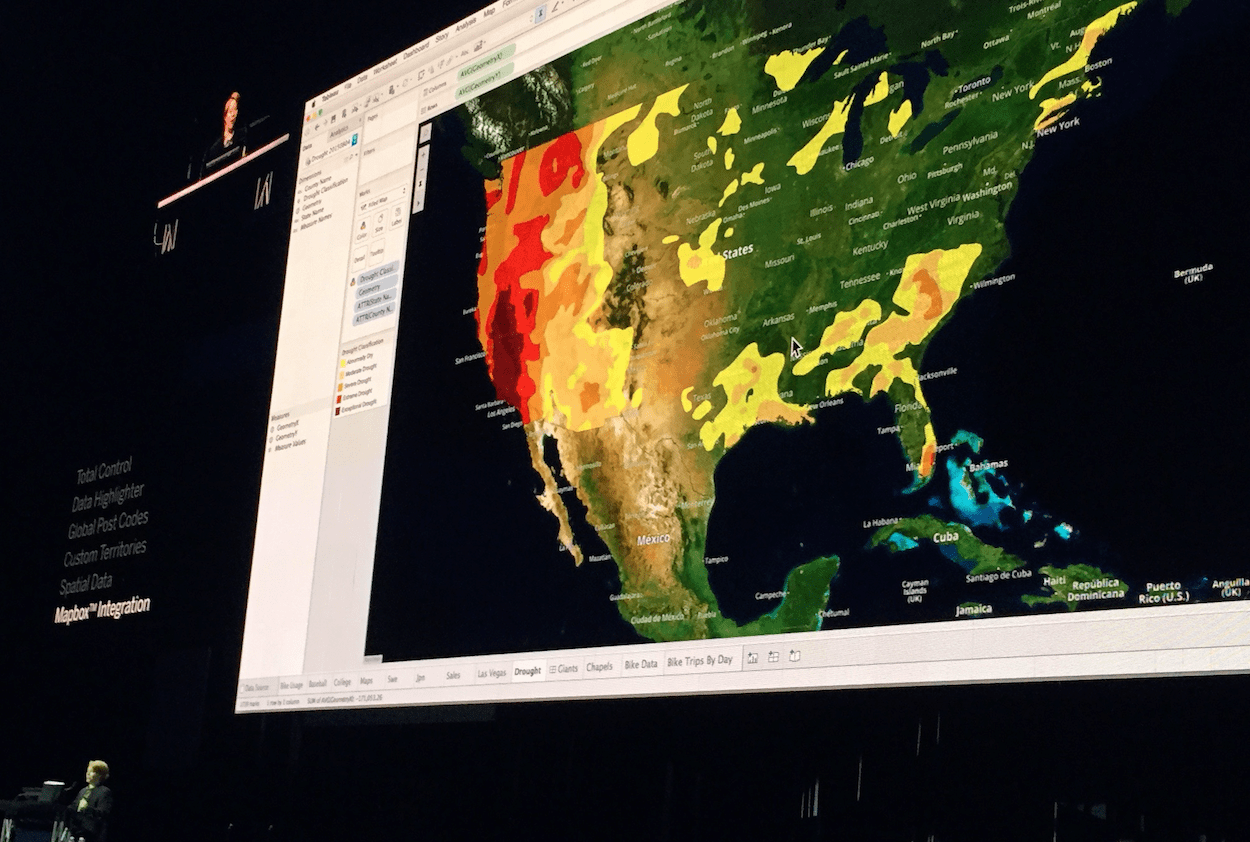
But Amy wasn’t done. Nooooo, she wasn’t. The world is a big place and maps are how we understand it. In 2016, we’re:
- Adding postcode level data for 76 more countries!
- Custom territories! “That’s wicked sick!” said Amy.
- Support for geospatial data files with a new Geometry field.
- Support for the sweet, sweet maps that Mapbox does.
Amy did show one more thing in viz, but you’ll have to watch the keynote to find it. Hint: it’s in the tooltip…

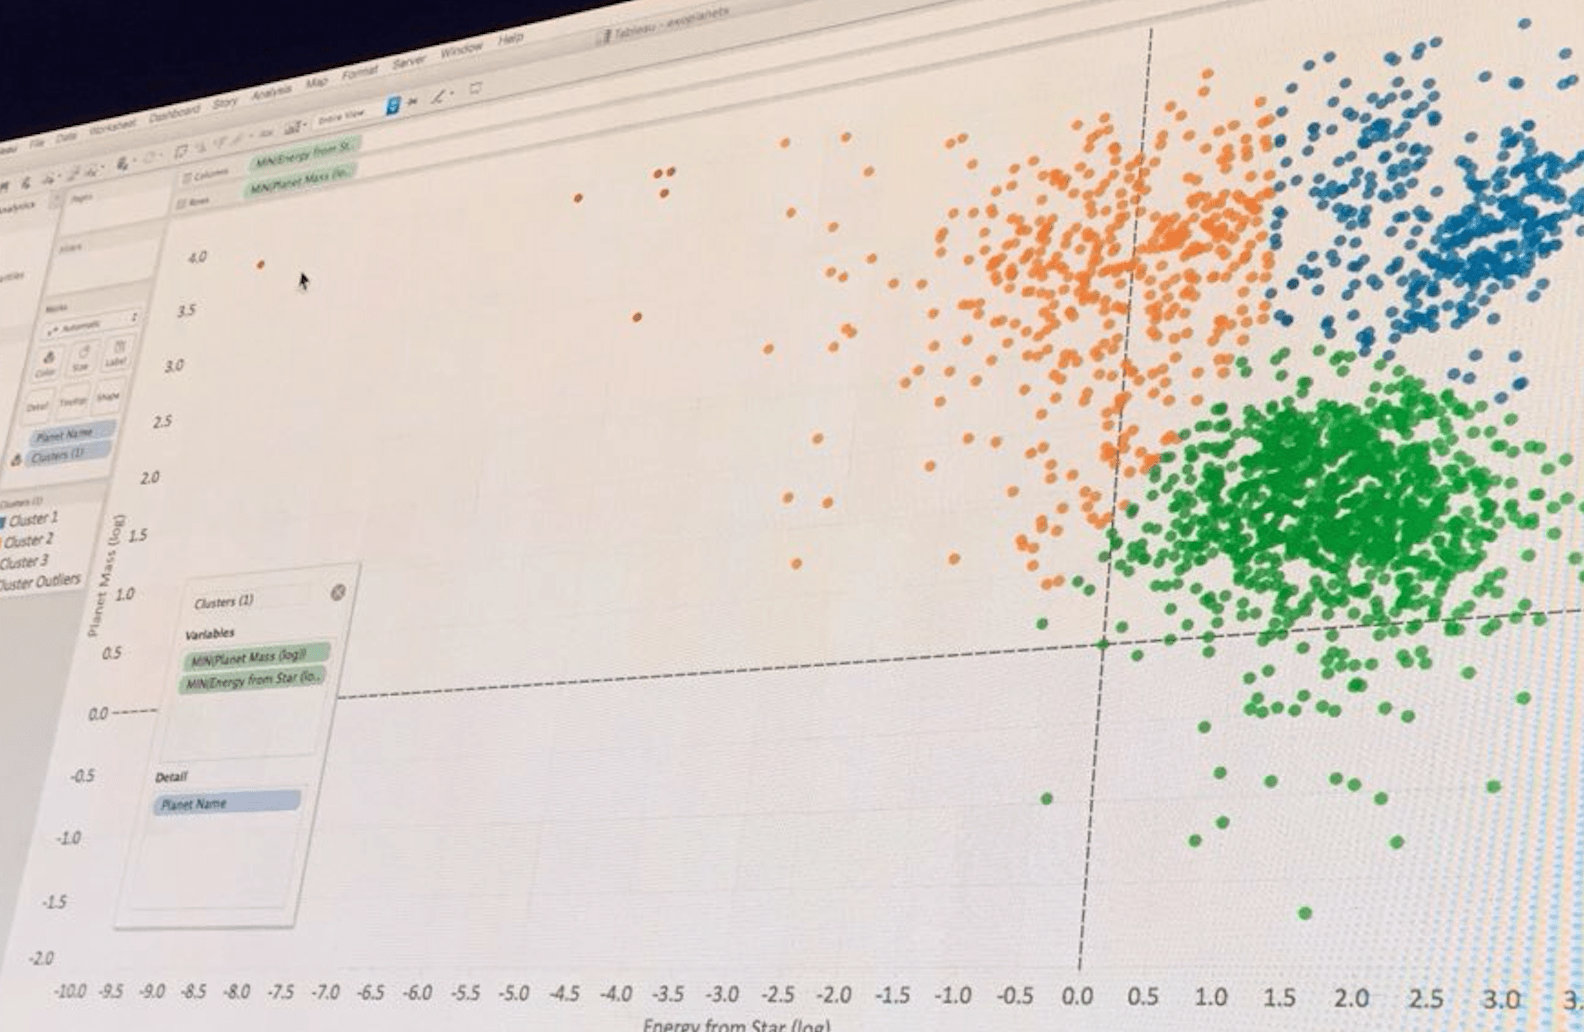
Advanced Analytics
Christine Chambers took us on a tour of smart new analytics features: Outlier detection and clustering. As with everything in Tableau, the defaults will be solid and you can change them as you want to. Then she did all kinds of star math, and then dropped the secret location of the next Tableau Conference: Apparently it will be on Kepler-452b. Get ready!
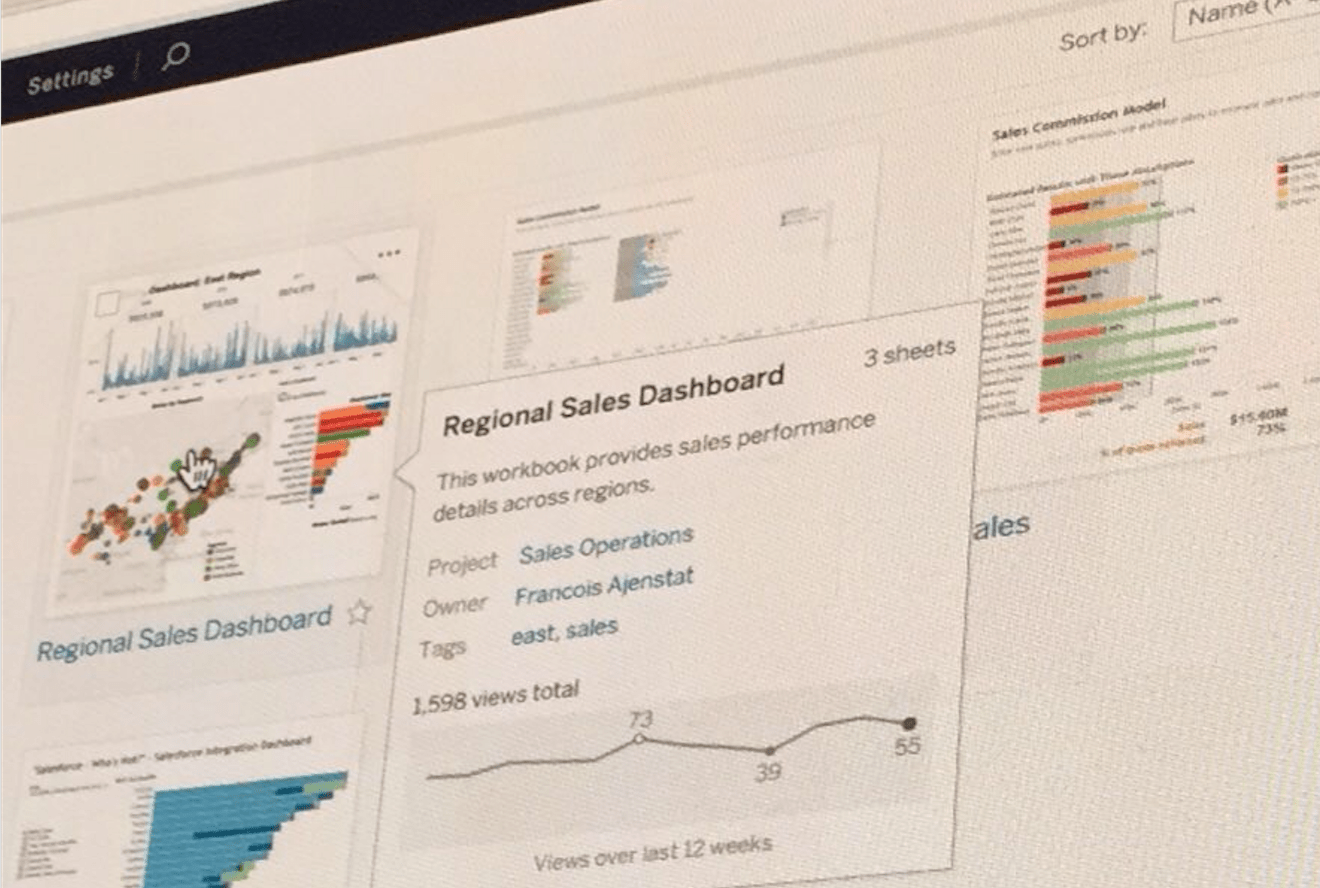
Self-Service
Tyler Doyle took to the stage to give out goodies to business users, power users and IT.
He promised every user a New Home Page that organizes their content. And he showed features that help people understand the most important shared content on Tableau Online and Tableau Server: sparklines and other visual content indicators for most popular, most favorited, and so on. So you can answer:
- What’s the most-used sales workbook?
- Who’s favorited this workbook?
- What about in the last two week?
For IT, Tyler dropped that version control is coming, so you can always feel safe about your data. And permission control at the project level, just because he’s a generous guy. Finally, Tyler and the team are working on a web app called Tableau Server Manager, one central place to do all your Tableau Server management.
Dashboards
Next it was time to check out dashboards with Michael Becke. He showed some sweet dashboards and told us what’s coming:
- Web authoring improvements
- Global formatting
- Cross-database filtering
Michael also showed a little thing called Device Specific Dashboards, which make dashboards look great no matter what device you’re looking at them on—automatically.

Mobile
Ronnie Yates, director of Mobile Engineering, took to the stage to blow our minds with highlights from the Tableau 9.1 release, which included a complete rewrite of the Tableau Mobile experience on an iPad.
Since they were on a roll, the Mobile team also wrote a native iPhone app for Tableau! It not only has all the goodness of Tableau Mobile, but it adds geolocation because you’re usually on the go when you’re on your phone.
'Project Elastic,' aka Vizable
There was one more presenter…but for more on that, I’ll send you over to Vizable. But if you remember "Project Elastic" from last year’s keynote, you’ll see something that looks familiar and is now available in the App store.

Well, that’s it for this year’s tent revival. Watch this space for more developments on these announcements, and see you at #data16!