Bars in Tooltips, Jitter-Plot Tutorial among Best of the Tableau Web
The heat of summer might make us all crave an ice-cold drink at the bar. Good news: Here's a way to bring the bar to your visualizations.
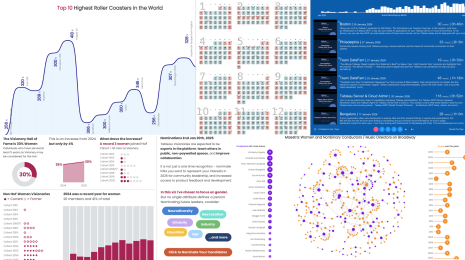
Tableau Social Ambassador Alexander Mou shows us how to raise the bar in our tooltips. He enhanced the tooltips of Jacob Olsufka's already-stellar Viz of the Day.
Head over to Alex's blog for the full details. And check out the rest of the Best of the Tableau Web below!
Tips & Tricks
Evolytics How and Why to Make Customizable Jitter Plots
Inviso Creating a Cyclic Network Chart
The Last Data Bender Manufacturing a Polygon from a Single Lat/lon Coordinate
Drawing with Numbers Sorting a Dimension by Two Values at Once
Beyond the Basics
Data Revelations There Is No Perfect Chart and There Is No Perfect Dashboard
Tableau and Behold! Embedding Web Edit in an iFrame
The Data School Drill Down Hierarchies in Tableau with Website-Style Navigation
Tableau Server
Databoss Reconfiguring Tableau Server without Restart (Part 2)
Visual Design
VizCandy Hey, Tableau Analyst, What Does the Data Say?
Inspiration
VizNinja Building User Engagement with Tableau Champions
Data + Brit Resources for Self-Improvement for Data Industry Professionals
The Information Lab Why Invest in Yourself by Going to the Conference?
Do you blog about Tableau? Tweet us @tableau and let us know!


