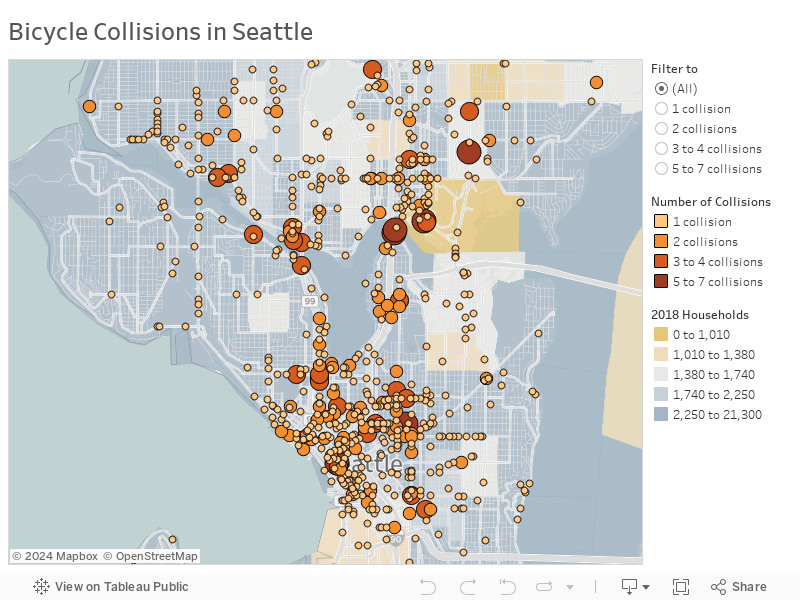
Visualize bicycle collisions in Seattle with built-in geocoding
Sanjay Bhatt of the Seattle Times used transportation data to visualize bicycle accidents around the city. The size of the dot represents the number of accidents at that location. You can zoom in on a neighborhood or select points of interest for comparison. You can also use this map view to visualize various citywide data sets on crime, traffic, and parks services.