Retailers today have more access to metrics than those in the past. As always, with metrics and business, if we can measure it, we can improve it — and retailers can improve their performance in a variety of ways. In this guide, we have compiled several of the most useful KPIs for tracking growth and performance in a retail business.
Retail KPIs, goals, and measures of success
The first step in creating retail KPIs is to define your business objectives, which can include the growth of your teams, locations, online revenue, and more. The next step is to create strategies to reach those objectives, and track the results of those strategies (metrics). KPIs should always ladder up to strategies that meet a business objective. Your business may use all or just a combination of the following metrics:
- Sales per square foot
- Gross margins return on investment
- Average transaction value
- Customer retention
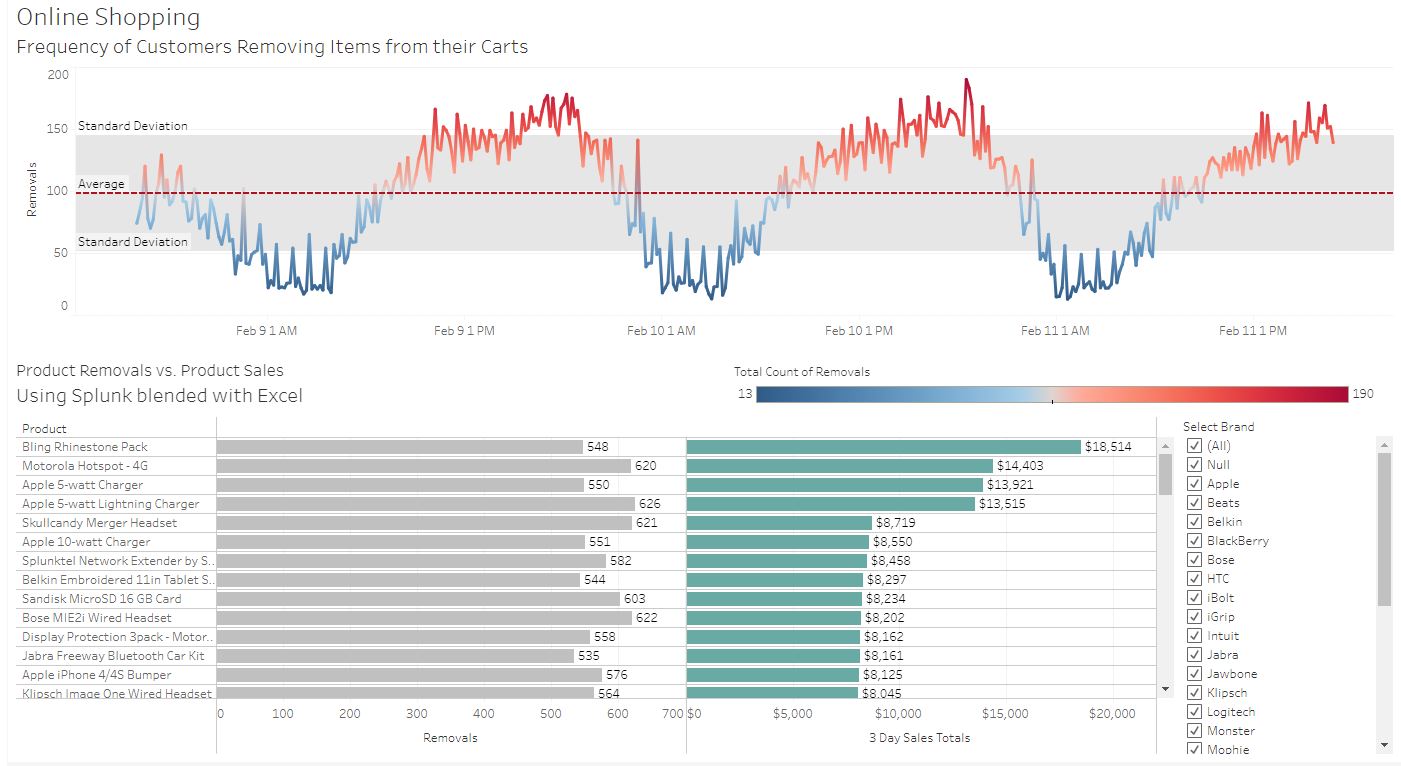
- Conversion rate
- Foot traffic and digital traffic
- Inventory turnover
The most common indicator of growth in retail is the sales volume. If you’re selling more, then you’re growing. However, growth encompasses more than just the number of sales, it also involves improving your processes. Improved processes can mean becoming efficient in reaching more customers, improving employee morale, and cost-effectively expanding or shrinking your inventory. In the end, those will translate to more sales and better business growth. Below are some of the most common retail KPIs to measure success.
Sales per square foot
Formula: Total net sales / Total square foot Sales per square foot is a compelling metric if you have a physical retail space. Sales per square foot measures how effectively you’re using the area you have, and sales per square inch is a good indicator of your store’s productivity while offering insights into store and merchandise layouts. You can visualize these insights with heat maps of your locations and dig into the data to determine why some merchandise performs better than others. If one section is performing better than another, it may be due to the types of products or their arrangement. When you see how the store layout is performing, then you can improve it and improve sales results. In practice, research in this area has found that products at eye level are more popular than products higher or lower on shelves. And retailers often place smaller consumable items by the register to encourage last-minute purchases. Retailers uncover these insights by sales by digging in and getting curious about square foot metrics.
Gross margins return on investment (GMROI)
Formula: Total gross profit / Average inventory cost While this one sounds similar in name to the baseline gross profits metric, its purpose is a bit different. GMROI measures the profit you make from the amount you invest in product stock. What this means in practice is that for every dollar you spend in your inventory, this KPI can tell you how many dollars you get back. Return on investment is vital to track for a couple of reasons. It offers more nuance than just sales or profit margins. GMROI generally tracks specific products or categories rather than inventory as a whole. Its specificity can tell you what is worth carrying in your stock and what is not, as well as what you could invest further in. The more you make on each profit margin, the better your retail business does as a whole. Growth comes when you find products worth investing in and have a good return on their initial costs.
Create beautiful visualizations with your data.

Average transaction value
Formula: Total sales from transactions / Total distinct count of transactions Sales is a useful metric overall, but it’s also helpful to know what people are buying and how much they’re spending each time they come in. Analysts or business teams can track and share these metrics in a shopping basket analysis dashboard. Average transaction values take sales and divide them to find out how much on average customers spend in your store each time they make a purchase. If you can encourage customers to increase their average purchase through merchandising strategies, identifying popular products, or shopping promotion programs, then your efforts will likely boost your profit and enable your company to grow.
Customer retention rate
Formula: ((Total distinct customers at end of period) - (Total new distinct customers acquired during period)) / (Total distinct customers at start of period) * 100 Customer retention is another useful metric for measuring growth. Being able to turn one-time customers into repeat customers is a steady profit generator for long-term growth. With digital sales, some tools can track the number of new customers versus repeat customers. You want to have a balance of each so you’re getting new hits while also sustaining existing customer relationships.
Conversion rates
Formula: Total number of conversions / Total number of analysis-relevant interactions * 100 This generalized KPI offers insight into what turns browsers into customers. While reach and marketing campaigns can get your name out there and people to your store, the only way to grow is to ensure your visitors convert into paying customers. Traffic and awareness has real value, but that value doesn’t do your business any good if you don’t get a measurable profit from it. It is worth also considering further analysis of of conversion rates, like:
- Whether or not existing customers are more likely to become repeat customers,
- how long customers take to convert,
- and which retail locations tend to have higher or lower conversion rates.
Foot traffic and digital traffic
Formula: Total store entrances OR Total sessions Measuring foot traffic and website visits are useful indicators of how well users know your brand, how successful marketing campaigns are, and whether your digital and physical storefronts are performing well. With this KPI, you can then improve or create strategies to generate more visits to your physical locations and to your website. This can entail using our list of effective marketing campaign KPIs or even sprucing up your window displays to draw traffic into the store.
Inventory turnover ratio
Formula: Total cost of inventory sold / Average inventory cost Tracking inventory turnover will help you figure out how fast inventory moves. If you’re sitting on stock for too long, you’re likely losing money. If you’re going through stock too quickly, then you may not be capitalizing on market demand as efficiently as possible. This is a great metric to keep an eye on over time to help understand which inventory items are affected most by seasonality. Inventory tracking can also help give insight into what is selling well and what isn’t. If a particular item is sitting on the shelves or in the stockroom for long periods, it may need a demand-generating campaign to spark interest, or it may need to be discounted and/or discontinued to make room for more profitable products. If you work with consumer packaged goods (CPG), you can customize a dashboard to show snapshots of your inventory and sales across all product lines. When you have that overview, you can take action if inventory is not performing to your desired KPI standards.
Using retail KPIs to reach business objectives
Hopefully, these KPIs can help you kick-start and track growth in your retail business. If you need help generating interest in your products or turning customers into sales, look for more information about KPIs for effective marketing campaigns and effective sales teams. Are you ready to start analyzing your data and setting the right goals for your business? Learn how data and analytics are transforming retail for the better with our resources here.