Using Custom Shapes as Dashboard Filters


Filters are one of the most powerful tools available to a data researcher. The ability to drill down into a dataset and analyze only the subset that is most relevant to a question can help solve even the most complex problems. Luckily, Tableau lets users easily create filters: quick filters can be added to worksheets or dashboards with just a couple of clicks.
But when creating a data visualization designed for mass-consumption, the analytical power of the visualization is not the only element worth considering, one must also factor in design. The look and feel – or overall design – of a data visualization is usually the first touch-point a user has with it, and in this first moment all amounts of clever research and analytical complexity that has gone into the project’s back-end is subsumed by the initial reaction of the user to its front-end. Thus we must all take careful consideration of the design of our visualizations, particularly as it pertains to user-friendliness, or, as I like to define it for myself, how easily a novice in your project’s subject matter can stumble upon your visualization and intuitively get how to interact with it.
So with these first two points in mind – the power of filters and the importance of design – let us get into the subject matter of this blog post: how to use custom shapes as filters.
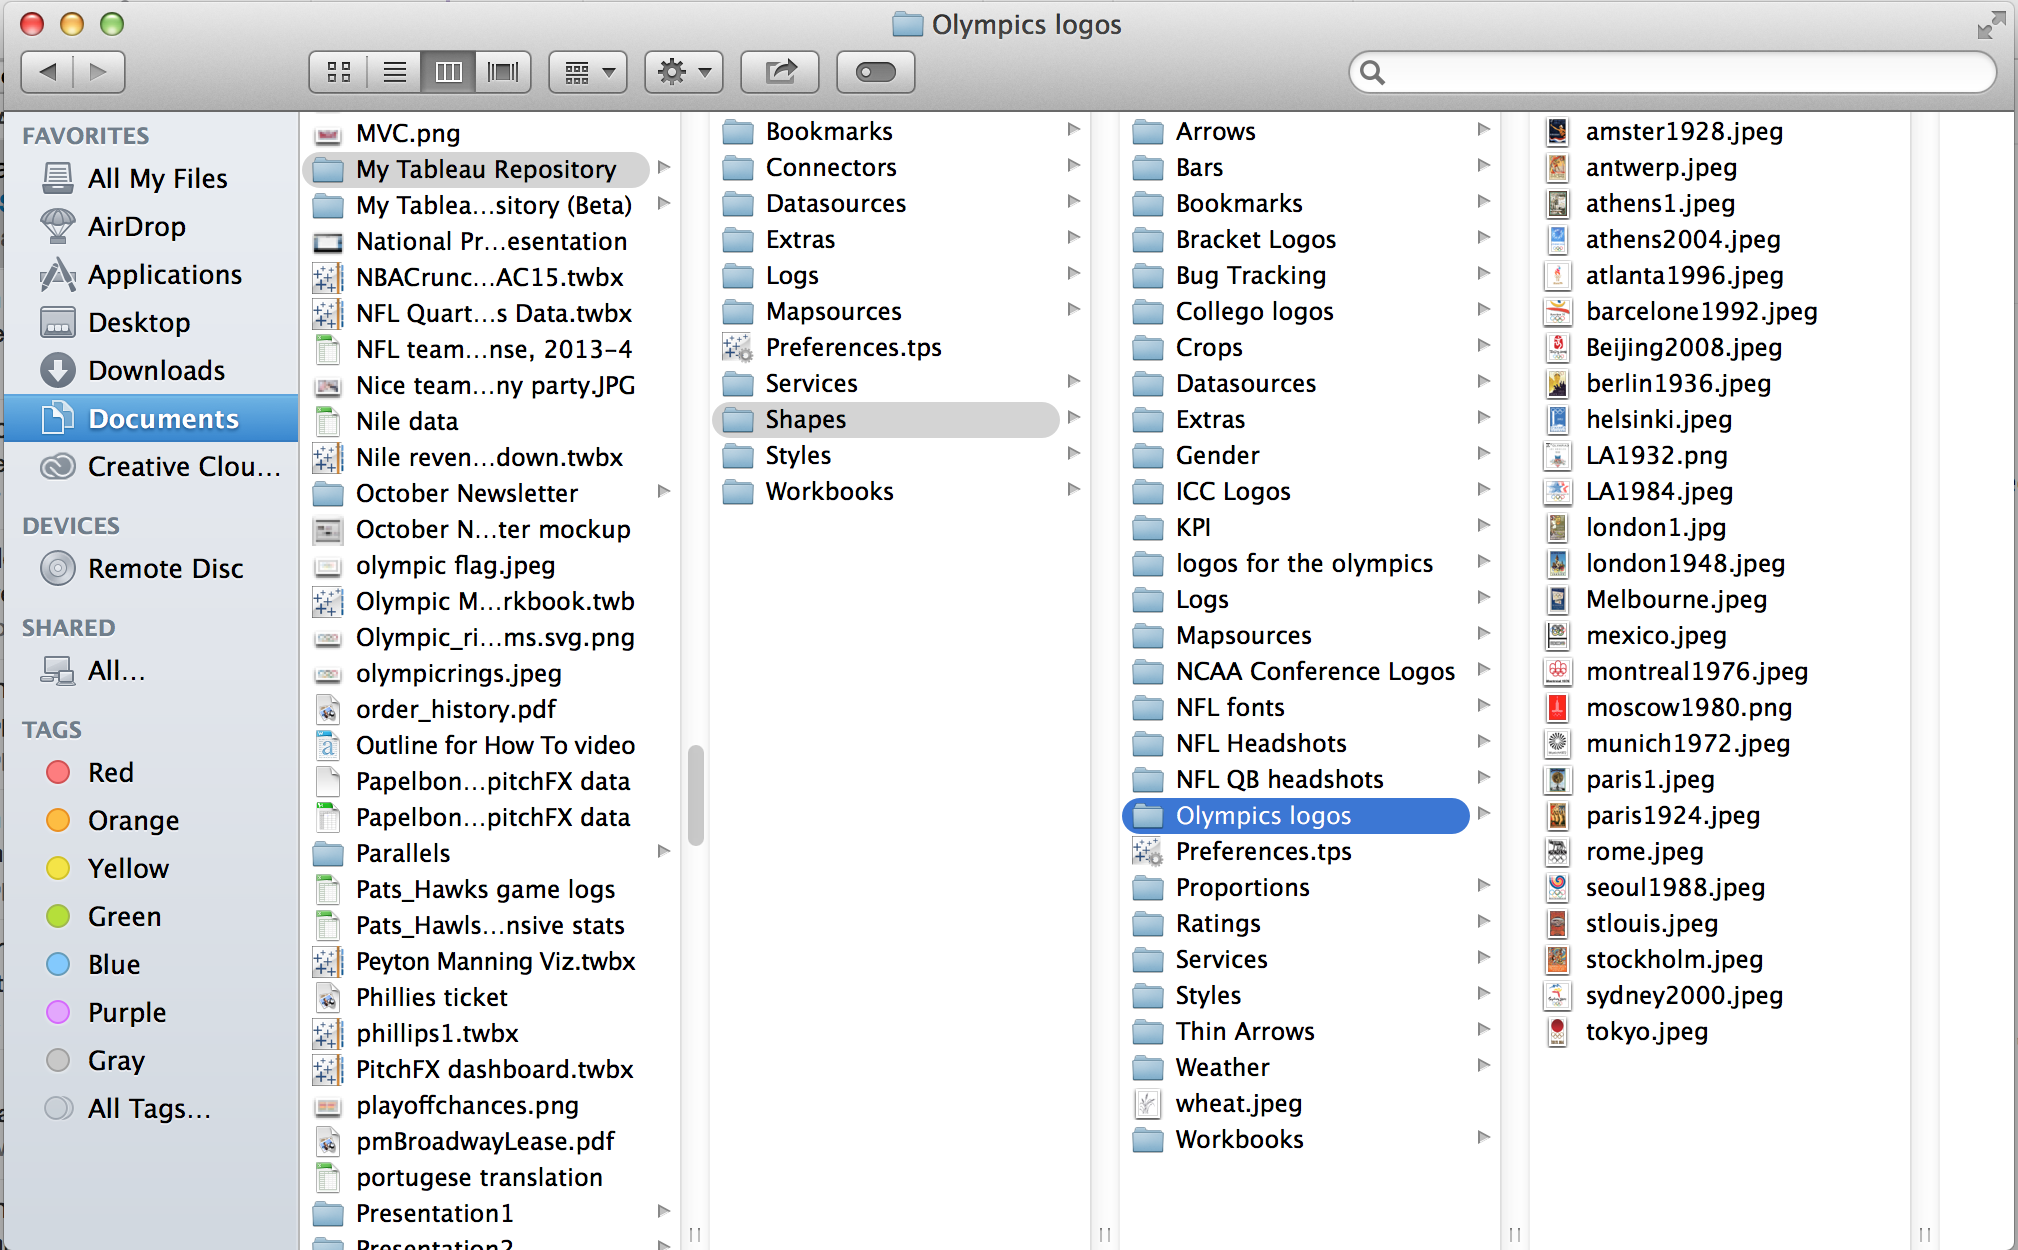
Creating custom shapes sound like a scary notion, but let me be the first one to assure you that they assuredly are not. Tableau makes adding custom shapes to your dashboard as easy as downloading an image to your computer and saving it in a particular folder. Really the only tricky part is finding the right folder to save your custom shape image files to, your “My Tableau Repository”. When you download Tableau Public a folder is created in your documents called “My Tableau Repository” and it is within this folder that a lot of Tableau customization, including custom shapes, takes place. There are many great detailed instructions on how exactly to add image files to your repository detailed instructions but essentially the process is as follows:
- Find image file on the internet – I normally just use google image and try to find consistent image formats if I am doing a set of shapes such as logos or flags
- Download image to your computer
- Drag images into your “My Tableau Repository” -> “Shapes” folder
- Open Tableau Public and your new shapes will automatically be included in your edit shapes menu
Once custom shapes have been added to a dashboard, you can use them in a visualization in many different ways, some of which are detailed in this blog post. Here we will focus on just one of these applications, using custom shapes as filters on a dashboard.
I like to use custom shapes as filters on busy dashboards that have multiple different charts and views on them. Custom shape filters can simplify dashboards by providing users an intuitive means of interaction, as well as adding a new pictorial element to the dashboard. Let me show what you mean by using an example of a project I have been working on recently, trying to visualize the all of the Summer Olympics medal winners from the first Olympic games in Athens in 1896 up through the 2008 Beijing games. Below you will see an early version of my “History of the Summer Olympics”.

Notice the jumbled layout and especially the incongruity of the filters. One of the seminal foundations of the Olympics is that each games occurs every four years in different cities around the world. I wanted to highlight this interesting factor in my dashboard, but it was clear after my first pass that a simple filter was not getting the job done, as it did not draw the viewer in to the data and it did not naturally compel interaction. To help solve this problem, I decided to try using custom shapes as a filter for each Olympic Games in my dataset.
The first thing I did was to find the logos for all the different Olympic Games online and drop them into the “My Tableau Repository” -> ”Shapes” -> ”Olympics Logos” folder I created within the “Shapes” folder”.
I was excited about utilizing the posters/logos for each different Olympic Games, as they manage to tell a history in of themselves: watch how graphical styles shifted from the Classical facsimiles in the posters of the1896-1948 Games, to nouveau minimalism from 1952-1980, ending up at our current state of abstract expressionism from 1984-2008.


After finding all of the posters online and saving them in “My Tableau Repository”, I was ready to start building out my worksheet that would serve as my custom shapes filter.
I wanted the posters to be at the top of the dashboard, to act as a header for the charts below them. So I created a new worksheet and put the year of the Games field (“edition”) on columns. Then I changed the marks card type from “Automatic” -> “Shapes” and dropped another copy of “edition” on to Shape in the marks card.
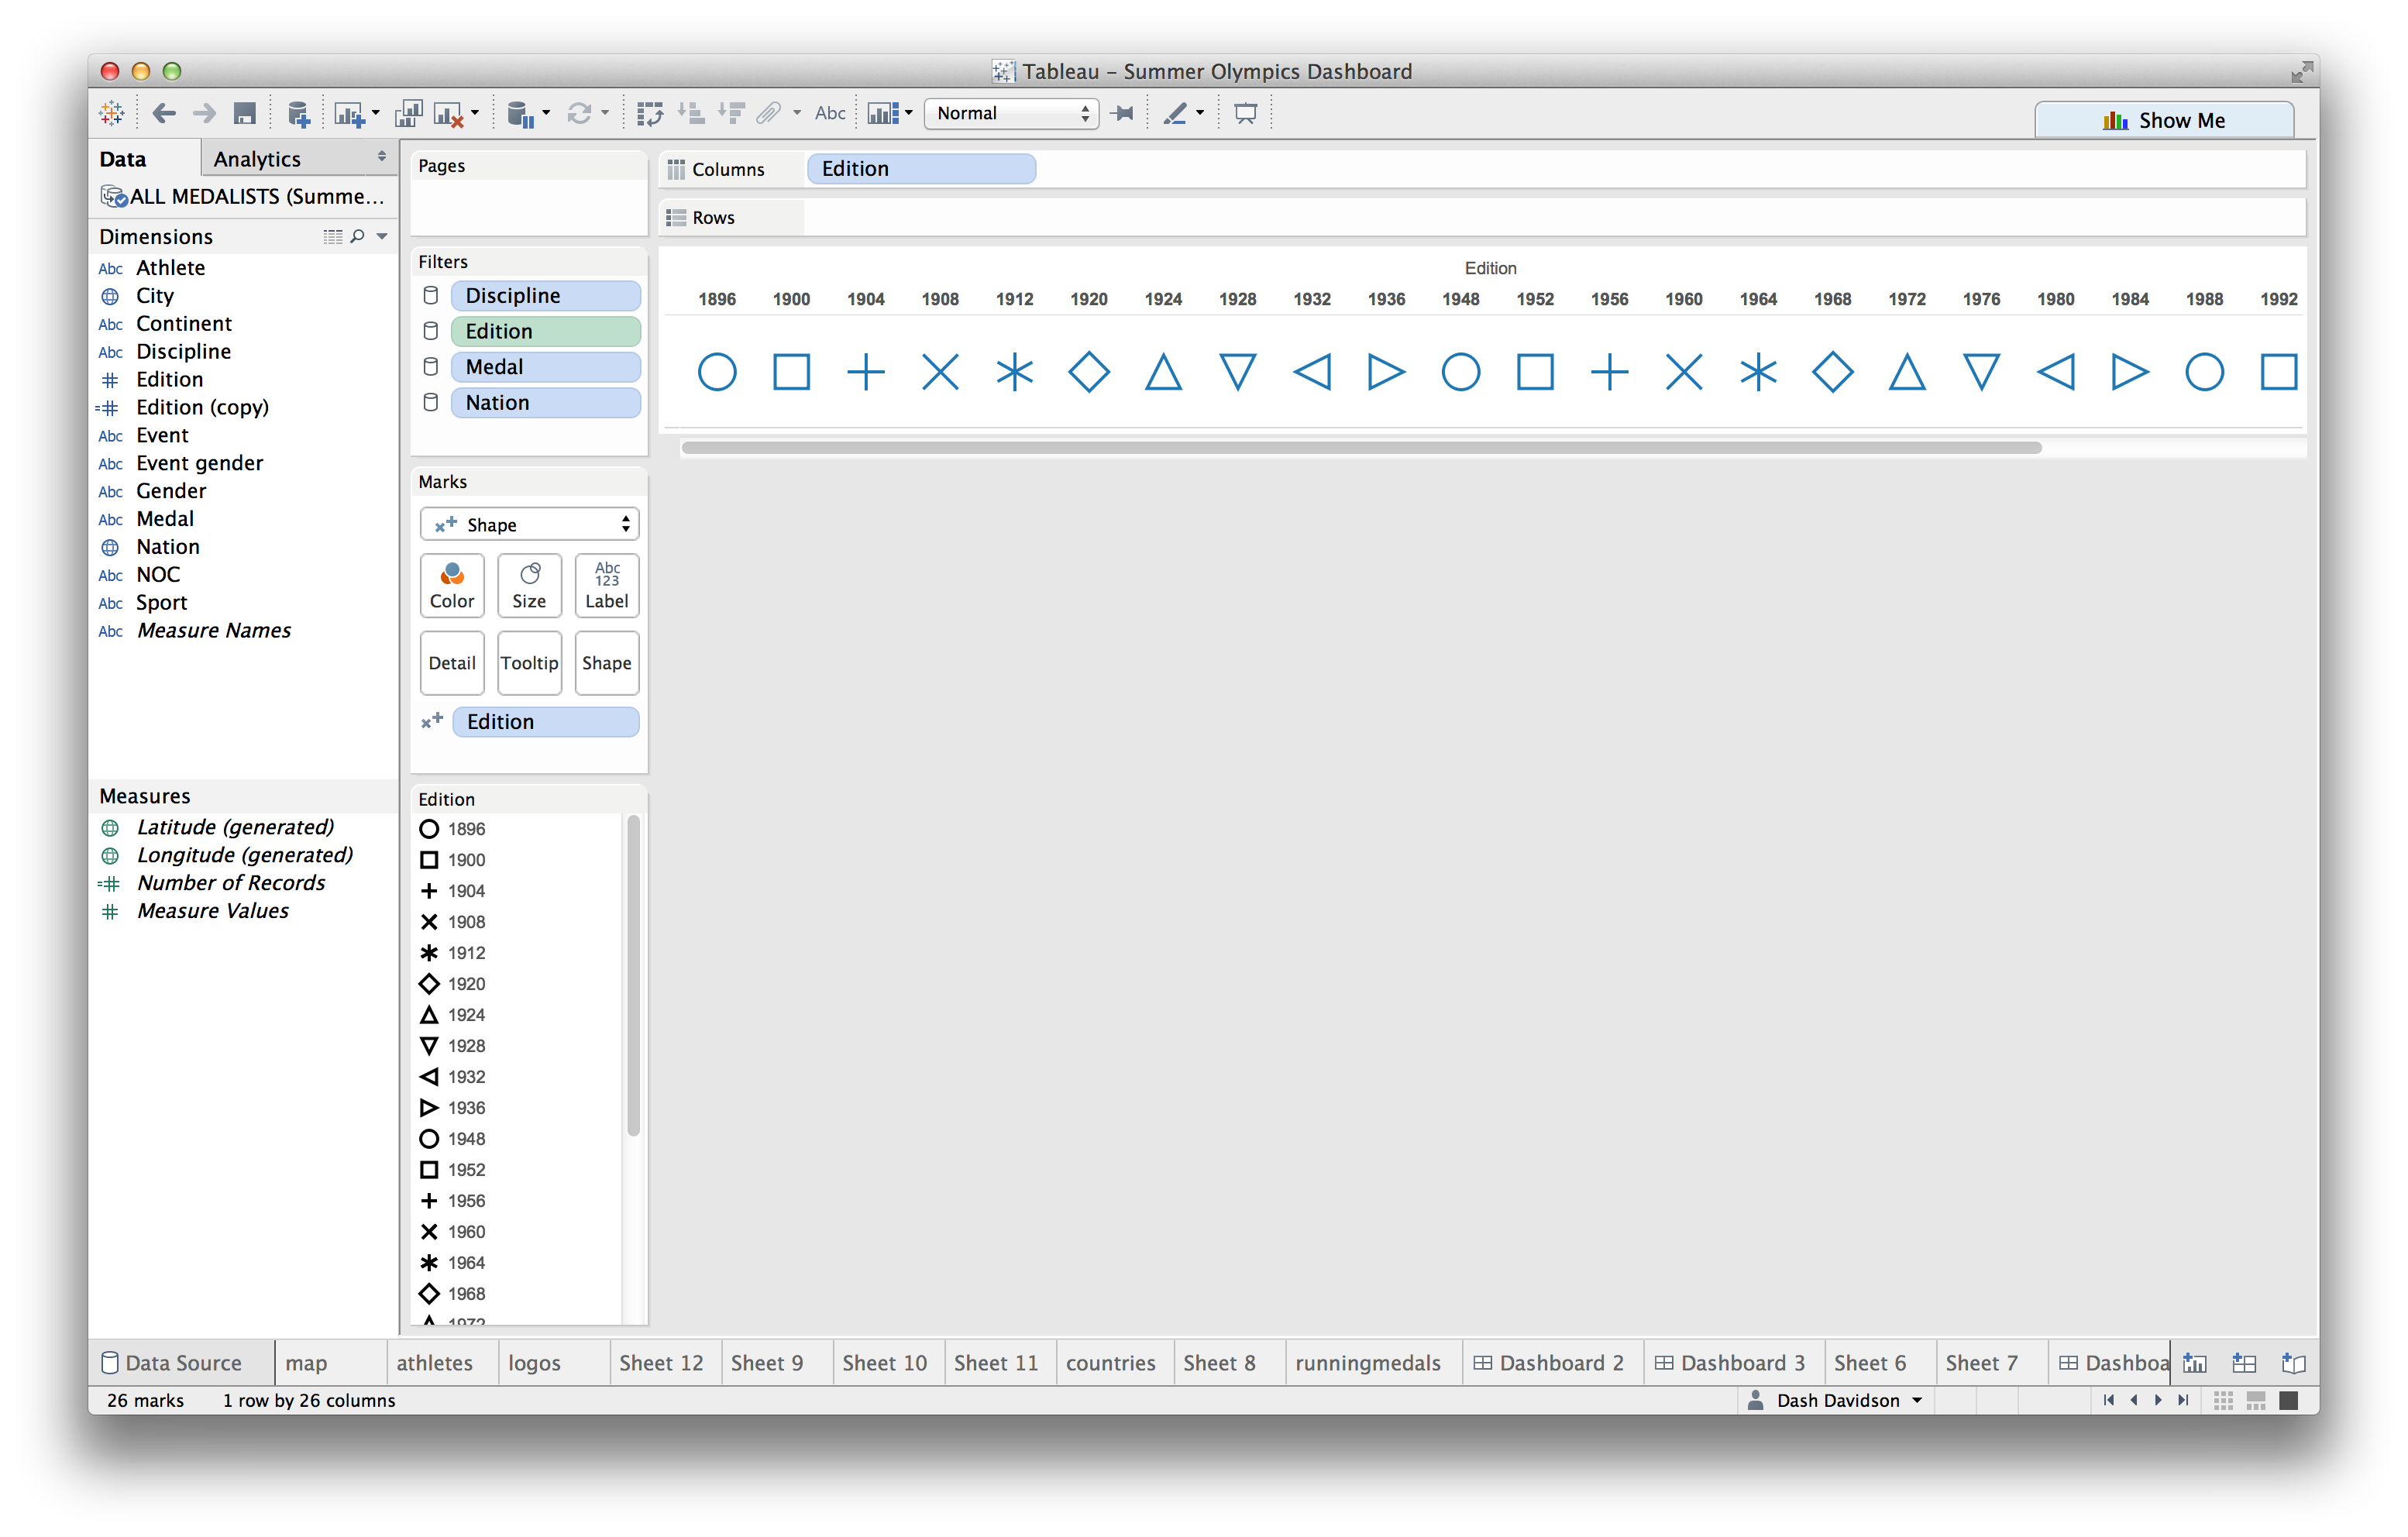
I then needed to select my new custom shapes folder and match up the editions of the Games with their respective posters. I clicked on “Shape” on the marks card, hit the drop down Shape Palette menu and switched from “Default” to “Olympics Logos” and matched up each Games with its poster.
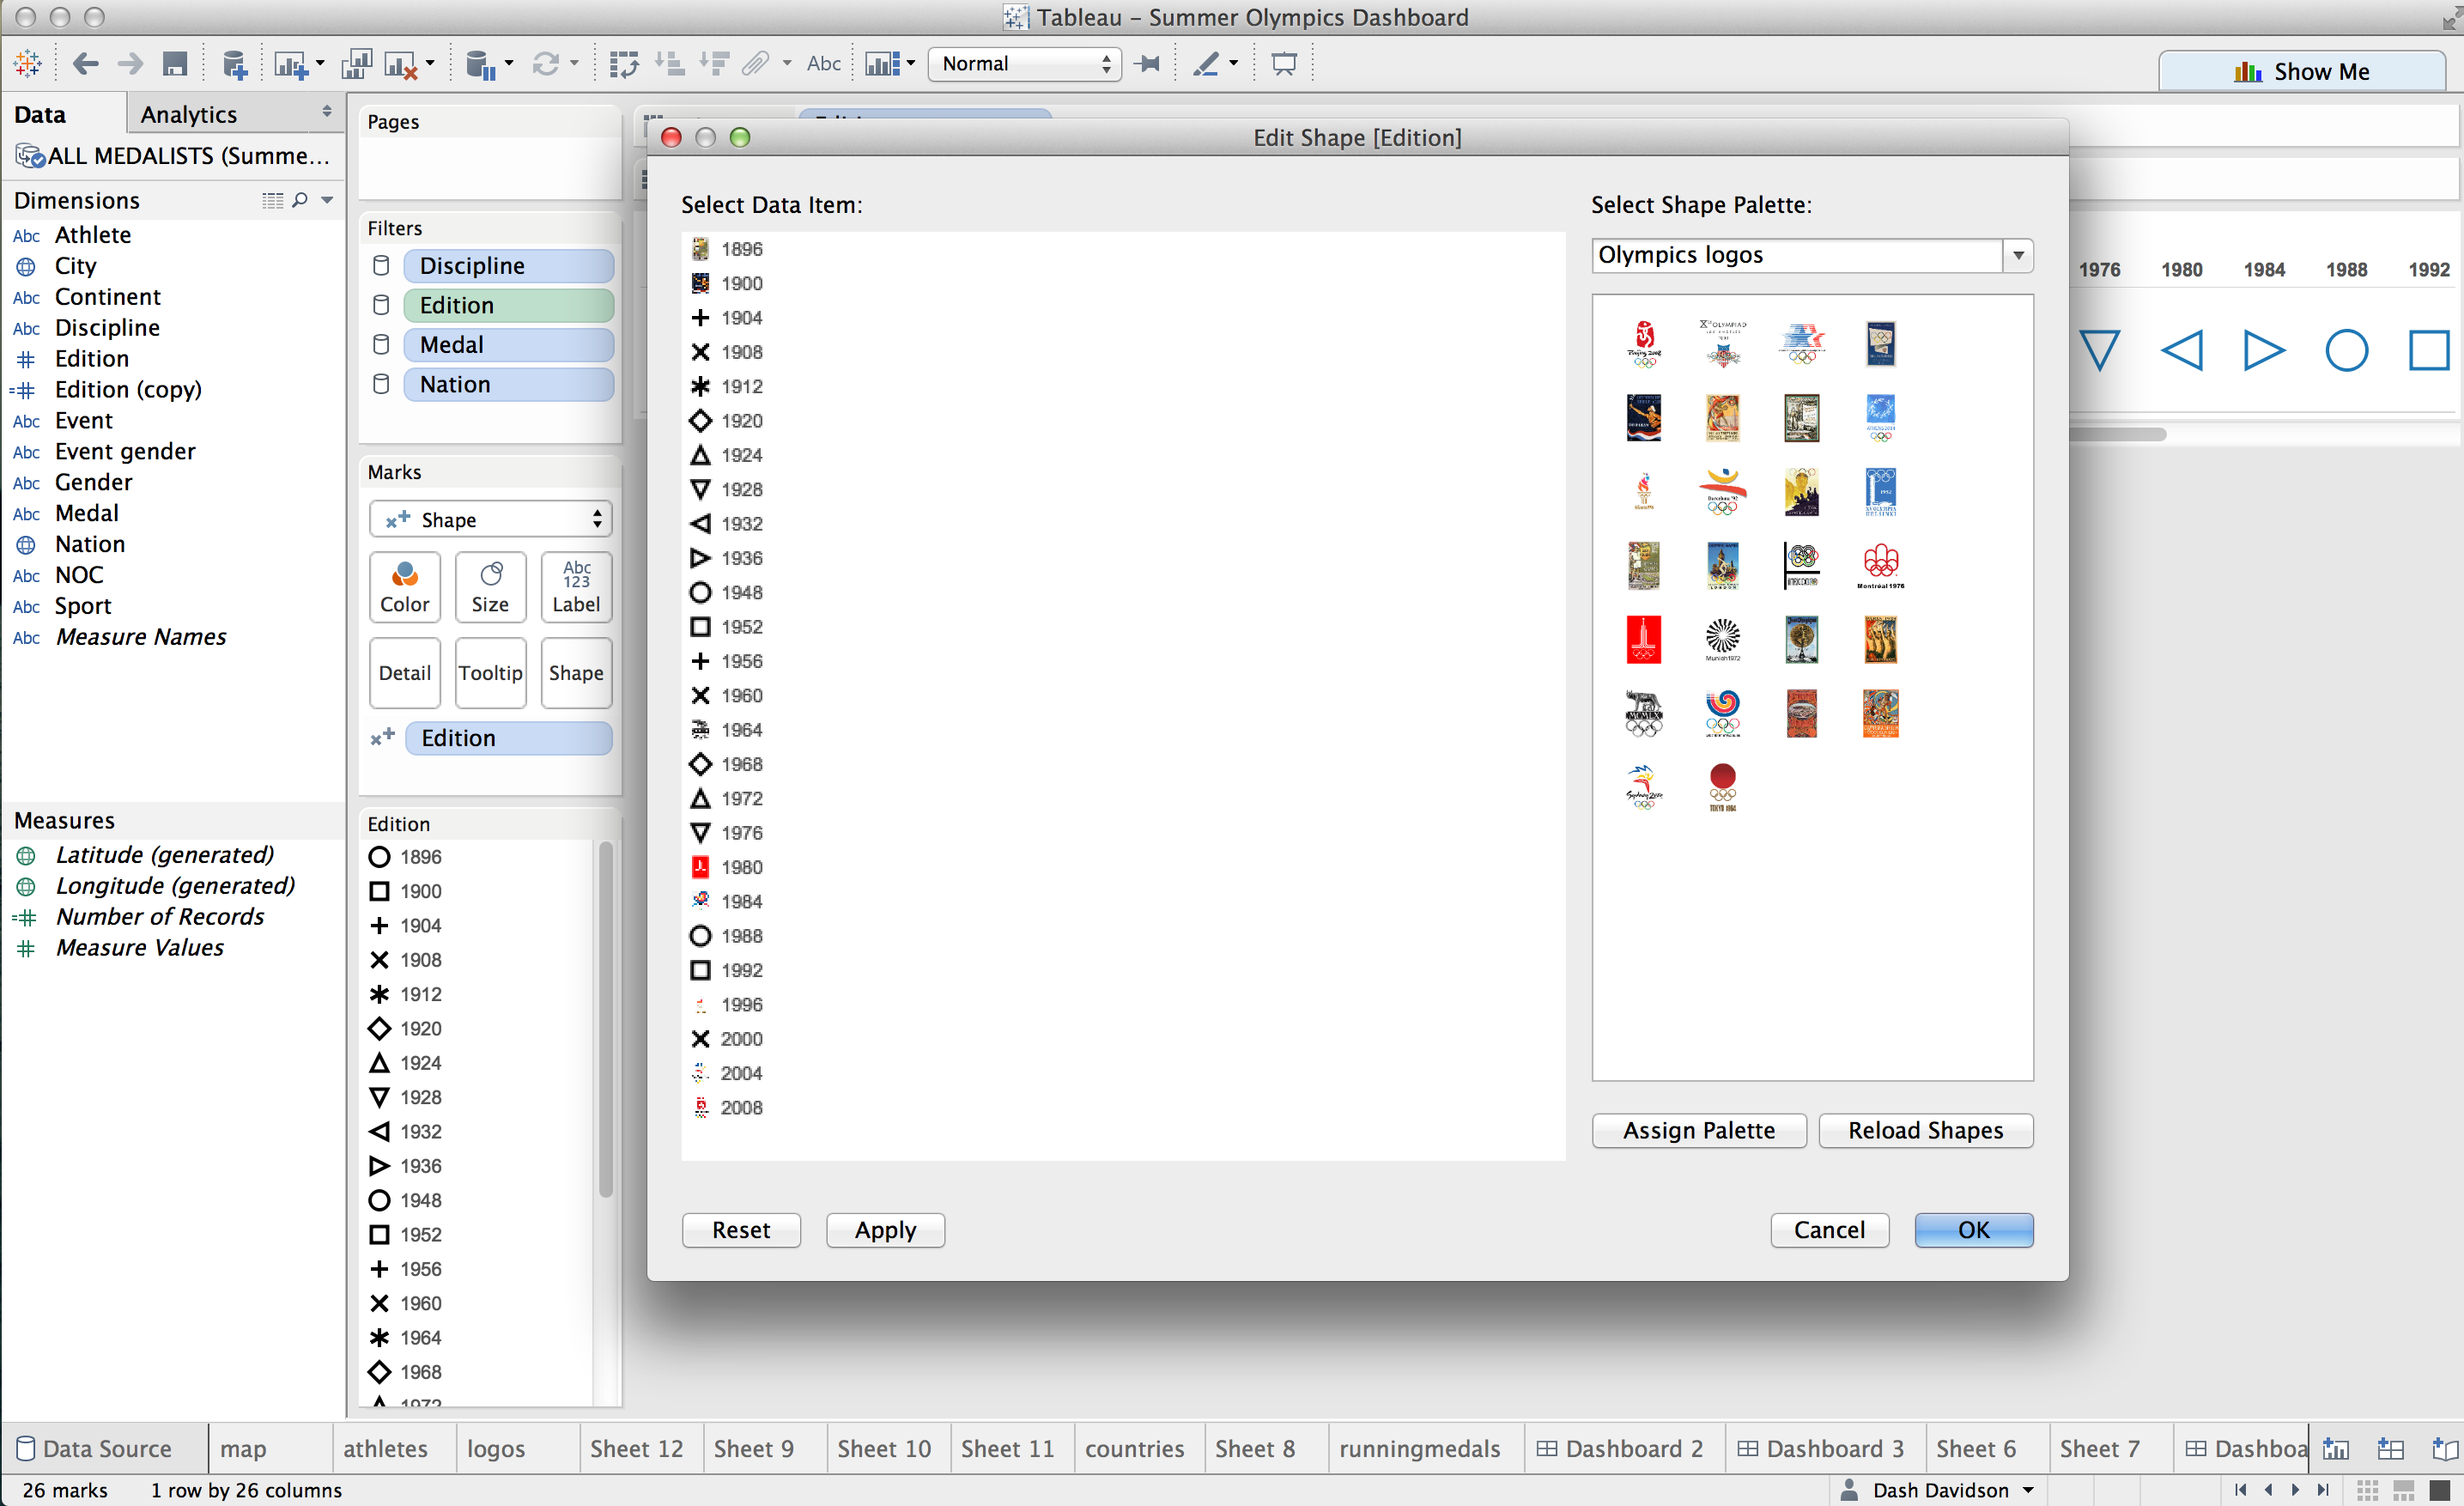
Now I had a worksheet with a header column of all my different Olympic Games with represented by the Games’ official poster. I could now add this sheet to my dashboard and set it as a filter so that when a user clicked on a particular poster the charts on the dashboard would filter to only show the data from that Games. Below is the final version of my Summer Olympics Dashboard, showcasing the design and interactive power of using custom shapes as a filter.

There are many great examples in the Tableau Public gallery of custom shapes being used as filters on dashboards. To list just a few:
- Ryan Sleeper's Odds of Going Pro in Sports
- Clara Siegel's Where have Dinosaur's Been Found?
- Angel Pilares's Copa America
- Dash Davidson's Best Fantasy Factories
We can't wait to see what you come up with. Make a Tableau Public viz using custom shapes and post the link in the comments below - maybe we will make it Viz of the Day!
Storie correlate

Iron Viz 2026: Read Between the Data
 28 Maggio, 2026

Tableau's Iron Viz Winners

Explore the 2026 Iron Viz Entries
 15 Dicembre, 2025