Co-Authoring Dashboard Text with AI


This is work co-authored by Maxim Lisnic (a Salesforce Summer 2024 intern at Tableau) and Tableau Research members Vidya Setlur and Nicole Sultanum, and was recently presented at the prestigious CHI 2025 conference. You can find the full paper and demo video on the Tableau Research website.
In 2024, our Tableau Research team published a blog piece on foundational work we did to elevate text as a first-class citizen in dashboard design, where discuss the crucial role that dashboard text plays in supporting dashboard use, expand on the rich space of design patterns with text, and propose heuristics for intentional usage of text in dashboards.
The next stage in that research was to apply our learnings on building tools to help dashboard creators author better text faster. To this end, we created Plume, a prototype system that leverages generative AI to provide various levels of support to dashboard authors. Plume builds on an understanding of what kinds of text are relevant to use in a dashboard and where, while offering tools to refine text based on objective metrics.
And yes, if you know a little bit of French, you may have guessed it: plume is French for quill, and stands as the text counterpart to tableau. Which is French for picture… or, in the case of (capital letter) Tableau, synonymous to “seeing and understanding data”.
In this blog post, we provide a sneak peek into how Plume leverages generative AI to support the various stages of dashboard authoring.
Overcoming blank page paralysis
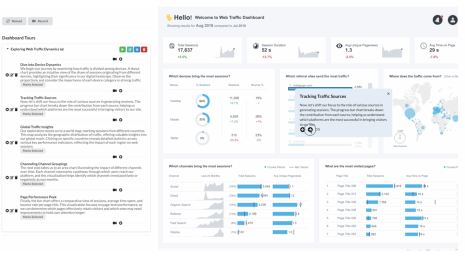
Imagine you have colleagues regularly travelling between New York City and Seattle, and you want to help them pack appropriately for the weather with a dashboard that showcases weather differences between the two cities. You open Tableau, load weather data, and create views to showcase average temperature and precipitation for each location. You then place your sheets on the dashboard, and now it is time to add appropriate titles and explainer text … which is quite a tedious task, as it requires text pieces to be added and positioned one by one.
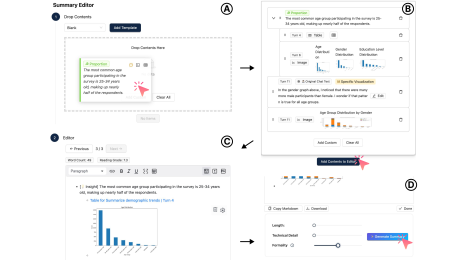
Plume was designed to significantly expedite this last step. The tool creates text snippets that are relevant to the data and visualizations, placing the snippets in semantically-appropriate places. All you have to do is choose what communication role you want your text to perform:
- Label data, with dashboard/section/chart titles.
- Provide context about the dashboard analytical goals.
- Provide insights emerging from the data.
- Explain encodings, or how a dashboard can be read.
- Explain metric, and what the underlying data represents.
- Explain interaction features of the dashboard.
- Add metadata, including author, data sources, and any disclaimers.
This list of communications roles is the result of a detailed breakdown and analysis of text we conducted over dozens of dashboards. Interestingly, we found that 96% of cataloged text belonged to one of the categories above, highlighting both the potential for automation and the usefulness of Plume’s suggestions.
At the same time, there is still a need for flexible content customization for the remaining 4% of cases. As such, all text generated by Plume can be manually edited–which is much easier than writing content from scratch. On the other hand, Plume also offers a number of assistive tools to evaluate and refine content.
Iterating and polishing, with expert assistance
Plume provides a control panel with additional tools to improve text quality. This functionality includes a series of indicators for standard text metrics: word count, word variety, and a readability score (which uses standard measures of how easy it is to understand that text), plus suggested ranges for these values. Plume also offers tools to shorten and simplify text so that text may fit the suggested metric ranges.
In the course of dashboard construction, the message you want to convey may change or evolve, or you may simply want the content rephrased a little differently. Via the same panel, users can re-generate any text over and over. The new text takes into account any updates or edits made elsewhere in the dashboard, as well as any optional instructions you provide with additional context and tone.
What's next: more AI autonomy, with oversight
Looking ahead, the future of Plume involves expanding AI capabilities while ensuring authors remain in full control. In particular, we envision Plume taking on more proactive roles, such as maintaining text consistent as the underlying data changes, or tweaking content for different audiences in the same dashboard – within well prescribed limits established by dashboard authors. Plume could also be extended to automate text formatting, such as bolding key takeaways, and matching color for text and data entities. We are excited to continue pushing towards elevating text as a first class citizen in Tableau.
For more details, check out the full research paper and demo video on Plume.
Storie correlate

Which Model Speaks Your Data Language? A User-Centered Approach to Evaluating LLMs for Conversational Visual Analytics
 14 Aprile, 2026
Rethinking How Data Workers Revisit Analytical Conversations and Communicate Insights
 10 Aprile, 2026
Stepping through Charted Territory: Creating Interactive Step-by-Step Dashboards Tours
 8 Giugno, 2025