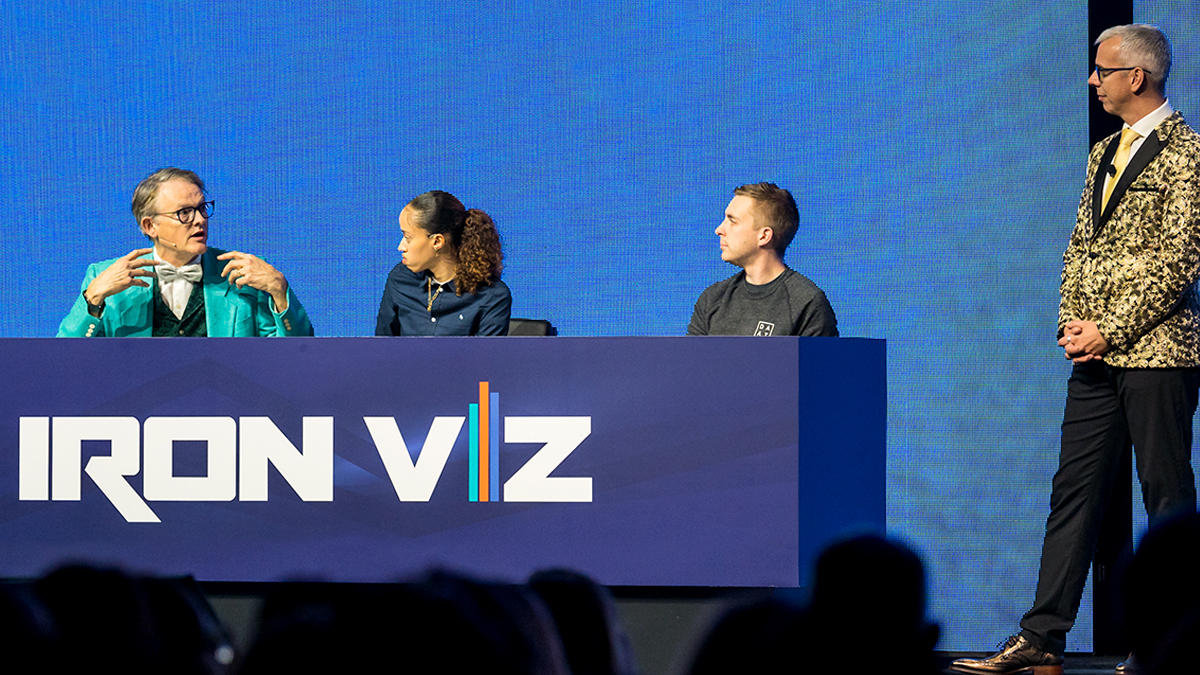
Notes from an Iron Viz Judge
Although this year’s competition will unfold on the screen instead of the big stage, Tableau’s Iron Viz remains the most incredible, intense “race” to create the perfect viz, and you don’t want to miss it! If you’re reading this, chances are you’re familiar with the competition. You’re probably already aware that three contestants will face off for the Iron Viz championship later this year.
The winner must create the best viz on the day of the championship (in less than 20 minutes) but also have previously submitted one of the top three highest-scoring entries in the Iron Viz Qualifier.
If you’re intrigued by the contest and interested to learn more about the competition, you’re in the right place!

About the author:
Karen Hinson has been a Tableau fanatic ever since she began using the software eight years ago. Today, she has the privilege of leading the Atlanta Tableau User Group and is honored to be a Tableau User Group Ambassador.
Interested in learning my key takeaways from my experience judging the 2021 Iron Viz Qualifier contest? Keep reading—this is your chance to collect ideas and suggestions from a judge to stand out in a future competition!

Behind the Curtain Look at the 2021 Judging Process
After the 2021 Qualifier contest closed on July 2, two rounds of judging took place to narrow down 320 entries to our three finalists. The judging team was made up of active Tableau community members (primarily but not exclusively Tableau Ambassadors and Zen Masters).
As a Round 1 judge, I was randomly assigned 65 submissions that I accessed via Tableau Online. Round 1 judges reviewed a large number of submissions so that each viz would be seen by at least three judges. We worked quickly to complete this round of judging in two weeks. Explore all the 2021 Iron Viz entries on Joy + Data.
I reviewed vizzes while on vacation with my family. I took my laptop to the pool. I judged while the baby was napping and in the evenings when the kids were asleep. After vacation, I continued to review workbooks on my lunch break and after work. Judging was fun, but incredibly time-consuming!
After the initial phase of judging was complete, scores were averaged and the top 20 continued to the second round of judging, where five new judges (including a former Iron Viz finalist and winner) reviewed each viz over the course of 10 days. With fewer vizzes to review, Round 2 judges were able to devote extra time and attention to the top 20. Big congratulations to this year’s finalists Lisa, Pradeep and Sam!

Scoring
Judges followed a rubric to score each viz on analysis, design, and storytelling. Every submission was judged on the same criteria and judging was blind. However, we all know data viz is a blend of art and science. A design that appeals to Judge A may be average or even off-putting for Judge B. The subjective part of judging was determining how high or low of a score to give under each of the three categories. When you consider how impressive submissions have to be for average scores to place them in the top 20, 10, or 3, it’s truly a remarkable achievement!
Surprises
The quality of entries I was tasked with judging ran the gamut from the most basic, simple dashboards I had to assume were built by beginners to ridiculously complicated, stunning creations from obvious experts. I was glad to see so many participants at various skill levels entering the competition. One thing that caught me off guard was the number of entries that were not related to the theme (Data + Joy), ie. It was sometimes hard to understand how the topic would bring someone joy. I also noticed there were quite a few submissions that were built for another community initiative (ie. Makeover Monday). I found it much easier to get excited about the entries that were built from scratch specifically for Iron Viz.
Advice from a Judge
If you plan to enter Iron Viz next year and aim to win, here are some decisions you can make along the way to maximize your score within each category.
You must acknowledge judges have limited time to explore your viz. Try to find ways to reveal the “main idea” or most profound insights from your analysis in a very clear way. Consider how long it takes to “digest” or understand what you’re trying to communicate. I came across plenty of fancy-looking, artistic visuals that were attractive, but not intuitive. These vizzes often required a detailed legend that I had to study for quite a while to decipher the meaning. I developed a strong preference as a judge for visuals that were clear and easy to understand.
Build something new and on-topic. Remember, to make it to the top 20 the stars need to align! You’ll need top scores from three Round 1 judges. The competition is fierce and this will be difficult with a repurposed dashboard. To be sure your submission stands out, dedicate the necessary time and effort to creating an impressive dashboard related to the Iron Viz theme.
Study all the 2021 submissions. Remember Iron Viz attracts the very best of the best. I recommend studying all the 2021 submissions and focusing on the top ten. It will be obvious the top ten excelled in analysis, design, and storytelling. Take notes and try to emulate some of the qualities and attributes you see in these submissions.
Tune in and watch Iron Viz 2021 at Tableau Conference! Watching the competition is sure to excite and inspire. Pick a favorite, tune in and cheer on the finalists!


