Infuse your Tableau dashboard with real-world AI and machine learning from Aible
Tableau and Aible are a great way to supercharge your data with AI to create a seamless BI + AI experience. The Aible extension for Tableau enables users to build predictive AI models directly within Tableau in minutes for a seamless experience.


By Dylan Steeg, VP of Business Development at Aible, and Riley Maris, Partner Marketing Manager, Tableau
Leverage machine learning models in Tableau with the Aible dashboard extension
Artificial intelligence (AI) represents the next step in unlocking value from data. AI can not only enable enterprises to better understand current business conditions, but also to predict what will happen in the future and take actions based on those predictions. Today, an increasing number of business users and analysts without formal data science training are harnessing the predictive power of AI through what’s become known as augmented analytics. By automating the simplest parts of the machine learning (ML) process, augmented AI extends model building to a broader range of users including business people, analysts, and developers.
Tableau and Aible are a great way to supercharge your data with AI to create a seamless BI + AI experience. The Aible extension for Tableau enables users to build predictive AI models directly within Tableau in minutes for a seamless experience. With a few clicks, Aible applies its library of ML algorithms to analyze your data, uncover hidden patterns, and deliver predictive business insights. Then use Tableau’s powerful visual analytics technology to dive deeply into those insights. The result: faster analysis and better decision-making.
Aible’s ML algorithms leverage a company's data sources to deliver specific recommendations. With Aible, you can embed AI models, predictions, and recommendations directly in the Tableau dashboard. Let’s take a look at a use case for sales opportunity optimization.
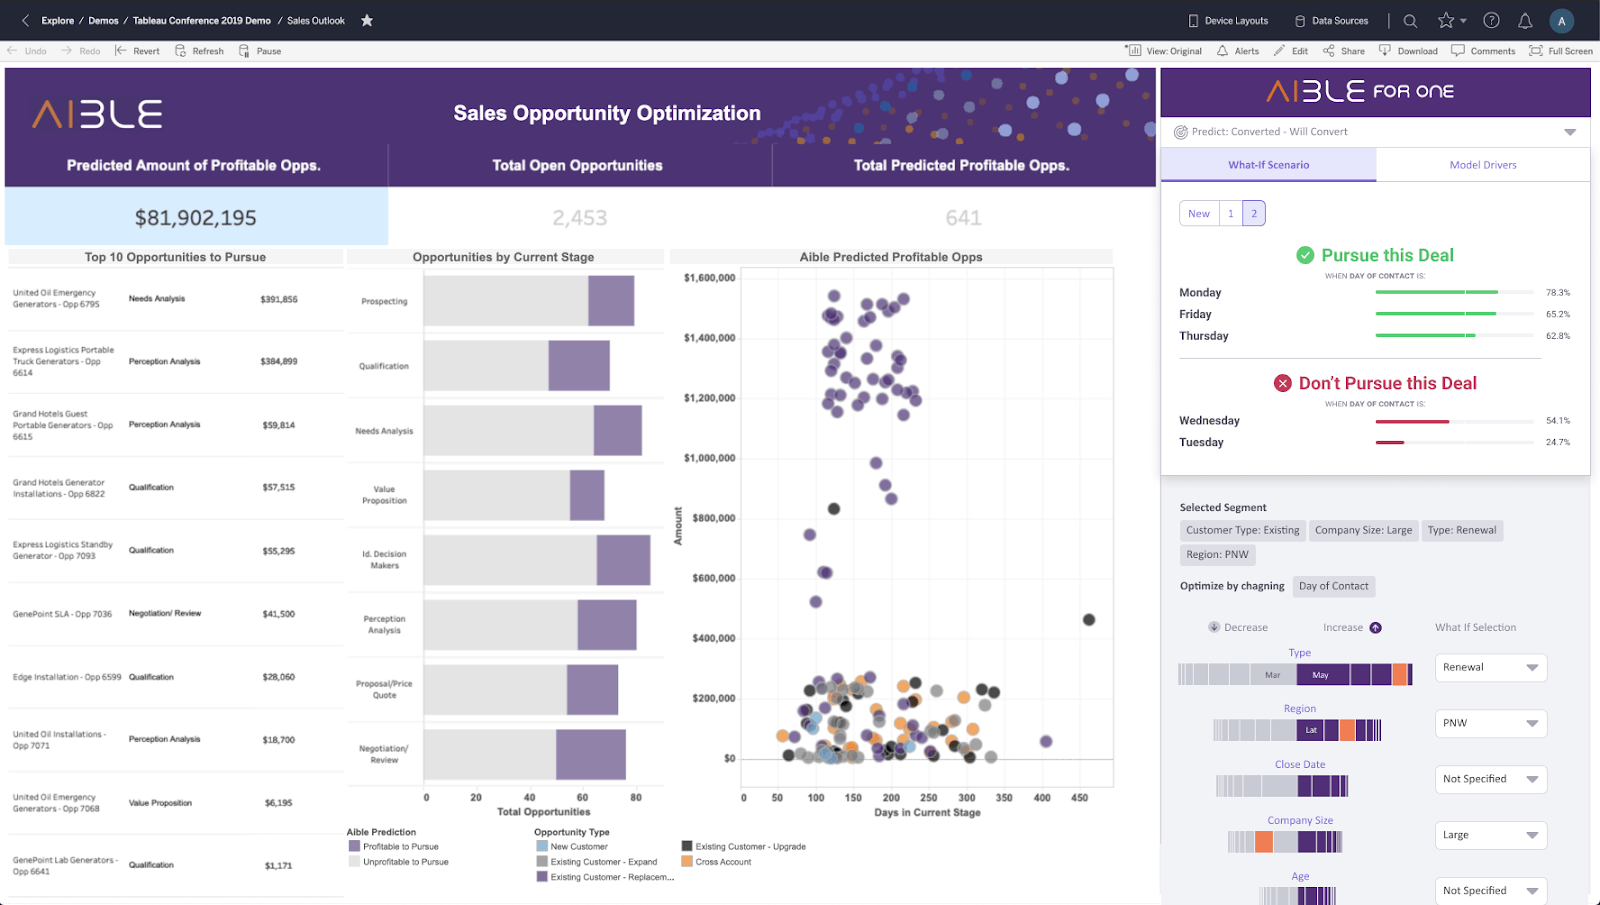
In this example of a Tableau dashboard augmented with Aible predictions, there are a few areas to note:
- The purple colors on the bar chart are opportunities that Aible machine learning models have identified as being profitable to pursue for each of the top ten opportunities, given the particular cost-benefit tradeoffs and capacity constraints of the business. The gray on the bars are deals that Aible models have determined are unprofitable to pursue.
- The scatter plot displays each profitable opportunity that Aible has identified, colored by the customer type. Click on any of the dots and you’ll see a pop-up window that spells out exactly who the target customer is, the value of the deal, the factors improving or reducing the likelihood of a sale, and most important of all, the recommended action—whether or not to pursue the deal.
- The pane to the far right shows the Aible extension in action. In this example, the user is running a what-if scenario based on four model drivers: type of customer (existing), region, company size (large), and type of deal (renewal). Below that, the user has chosen to optimize by adjusting the salesperson’s day of contact.
Building AI models and running what-if analyses
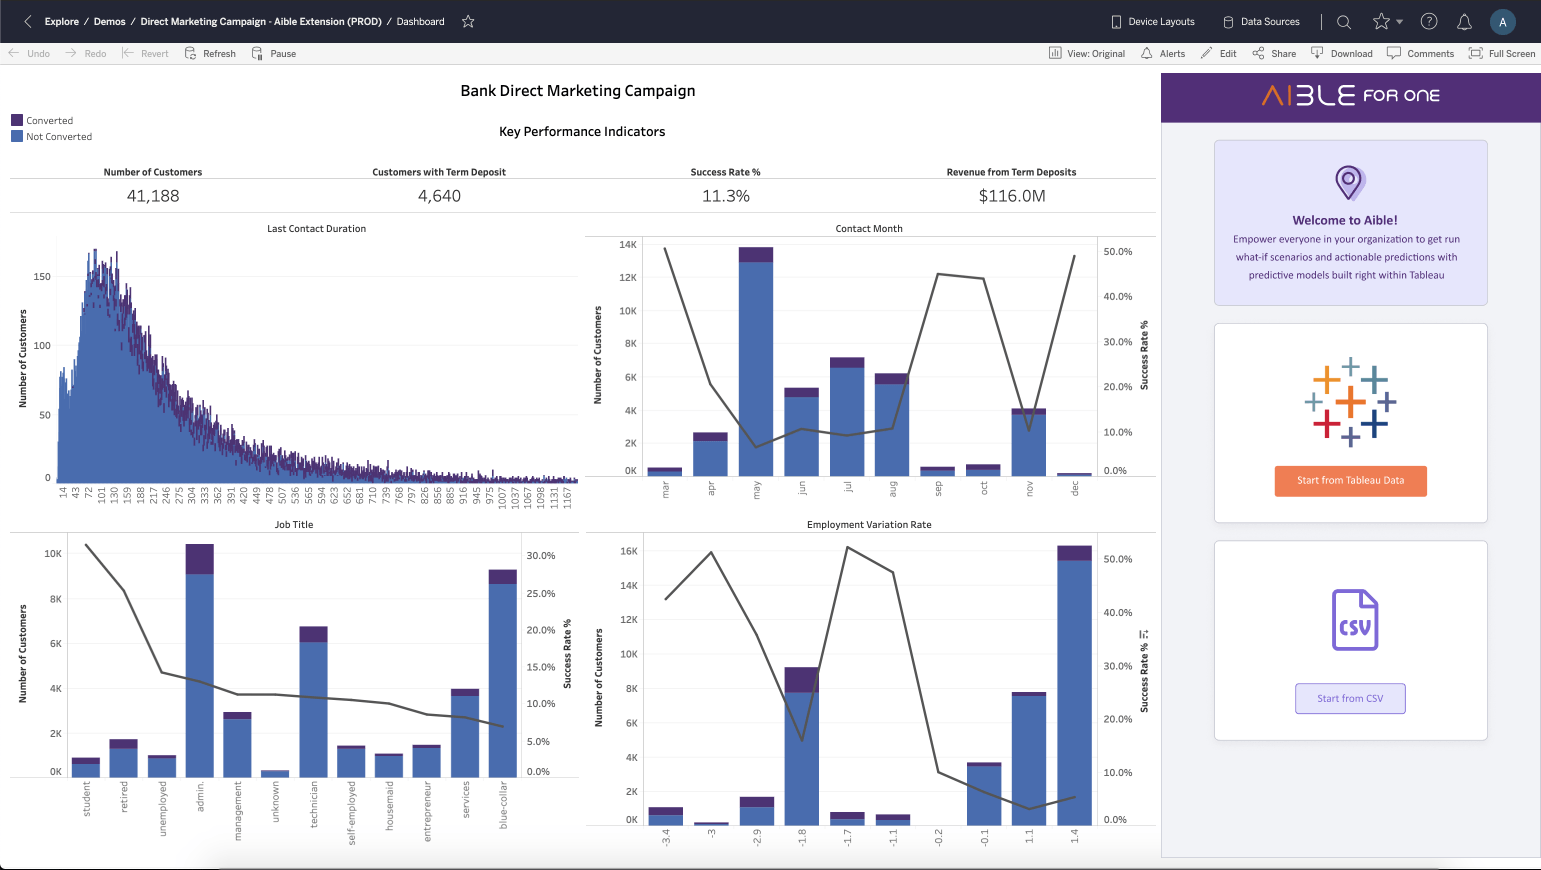
You can start to build models and create what-if scenarios alongside your dashboard by following the steps outlined below. The dashboard shown in the example below is a bank’s direct marketing campaign for new term deposits. The right side of the dashboard displays an Aible extension where you can run models and what-if scenarios.
First, select the data you want to use to build a model. You can either use the data directly from Tableau’s datasource or upload a csv file, as shown below.
Next, select the cost ratio that closely matches your use case. If you are not very sure of the cost ratio, you can start with the “no cost ratio” option.

In the next screen, you can see the predictors of the model and option to create what-if scenarios.

The column and values of the what-if scenario can be selected from the predictors as shown below. In the given example, the user is trying to create a what-if scenario using Contact Month (August), Last Contact Duration (5), and Job Title (SVP), while optimizing on Day Of Contact.

As shown in the example, the model is suggesting to take action (Will Convert) and is optimized on Day of Contact. You can run multiple what-if analysis by selecting the “Editing What If” option.

Aible delivers a portfolio of models tuned to different business realities, rather than a single model. With a portfolio approach, models can be specialized for a wide variety of factors such as different geographies, departments, products, or marketing campaigns. As new data is generated, some models that performed well may start to decay, while another model may show rapid improvement. Aible pre-calculates the best AI for thousands of potential business realities, creating an “efficient frontier” of AI models that ensures the best model for every business situation.
Please reach out to Aible Customer Success via support@aible.com if you have any questions.
Get started with the Aible extension for Tableau
Working together, Tableau and Aible provide a powerful tool that enables businesses to unlock the value of their data and accelerate digital transformation. Visually-compelling AI insights and recommendations embedded in Tableau deliver what every user wants from AI: data-driven decisions that result in better business outcomes.
To get started, download the Aible dashboard extension from the Tableau Exchange. Please note: You must have licenses for both Tableau and Aible.
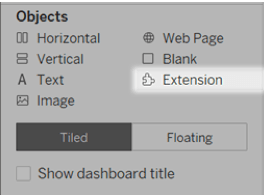
Next, add the Aible extension to your Tableau dashboard. In the dashboard, under Objects, select Extension and drag it on to the dashboard.
In the “Choose an Extension” dialog box, click My Extensions, and navigate to a .trex file that you had previously downloaded.
Please visit Tableau Help for more information on dashboard extensions.
Storie correlate
Tableau and dbt Labs: Strategic Partnership and Integration
 25 Agosto, 2025

Supercharge Analytics with the Power of AWS-Hosted TabPy
 14 Ottobre, 2024
Tableau + AWS: Accelerating your digital transformation with Modern Cloud Analytics
 27 Novembre, 2023
Tableau and AWS help customers digitally transform with Modern Cloud Analytics, combining technical resources and expertise with our vast partner networks.