Data innovations in public health: PATH creates COVID-19 diagnostic test dashboard


The COVID-19 pandemic has forced the scientific, medical, and public health communities to innovate on a scale not seen in modern human history. From vaccine development to understanding the impacts of new variants, leaders from these disciplines are leveraging a vast ecosystem of data to find answers, and make decisions that ultimately affect millions, if not hundreds of millions, of lives.
One critical focus is testing. In order to lessen the impacts of COVID-19 on global populations, it’s essential that public health organizations are able to procure massive inventories of testing kits—which requires confidence that diagnostics are high-quality, available, and affordable. It may come as a surprise to those outside the world of diagnostic testing, but not all tests are created equal. From manufacturer to manufacturer, there are vast differences in test quality, performance, and availability, making it difficult for public health officials to determine what tests are the best choice for their situation. Furthermore, because there are no uniform regulations for diagnostic tests, manufacturers face a low bar to enter the market.
To date, there are over 1,000 diagnostic kits to choose from—clearly, far too many for already-overwhelmed agencies to evaluate individually.
This is where PATH, a Seattle-based global health non-profit, is providing a much-needed, data-driven solution in the form of a Tableau dashboard that aggregates publicly available data related to the development, supply, regulatory approvals, and performance of COVID-19 diagnostic tests.
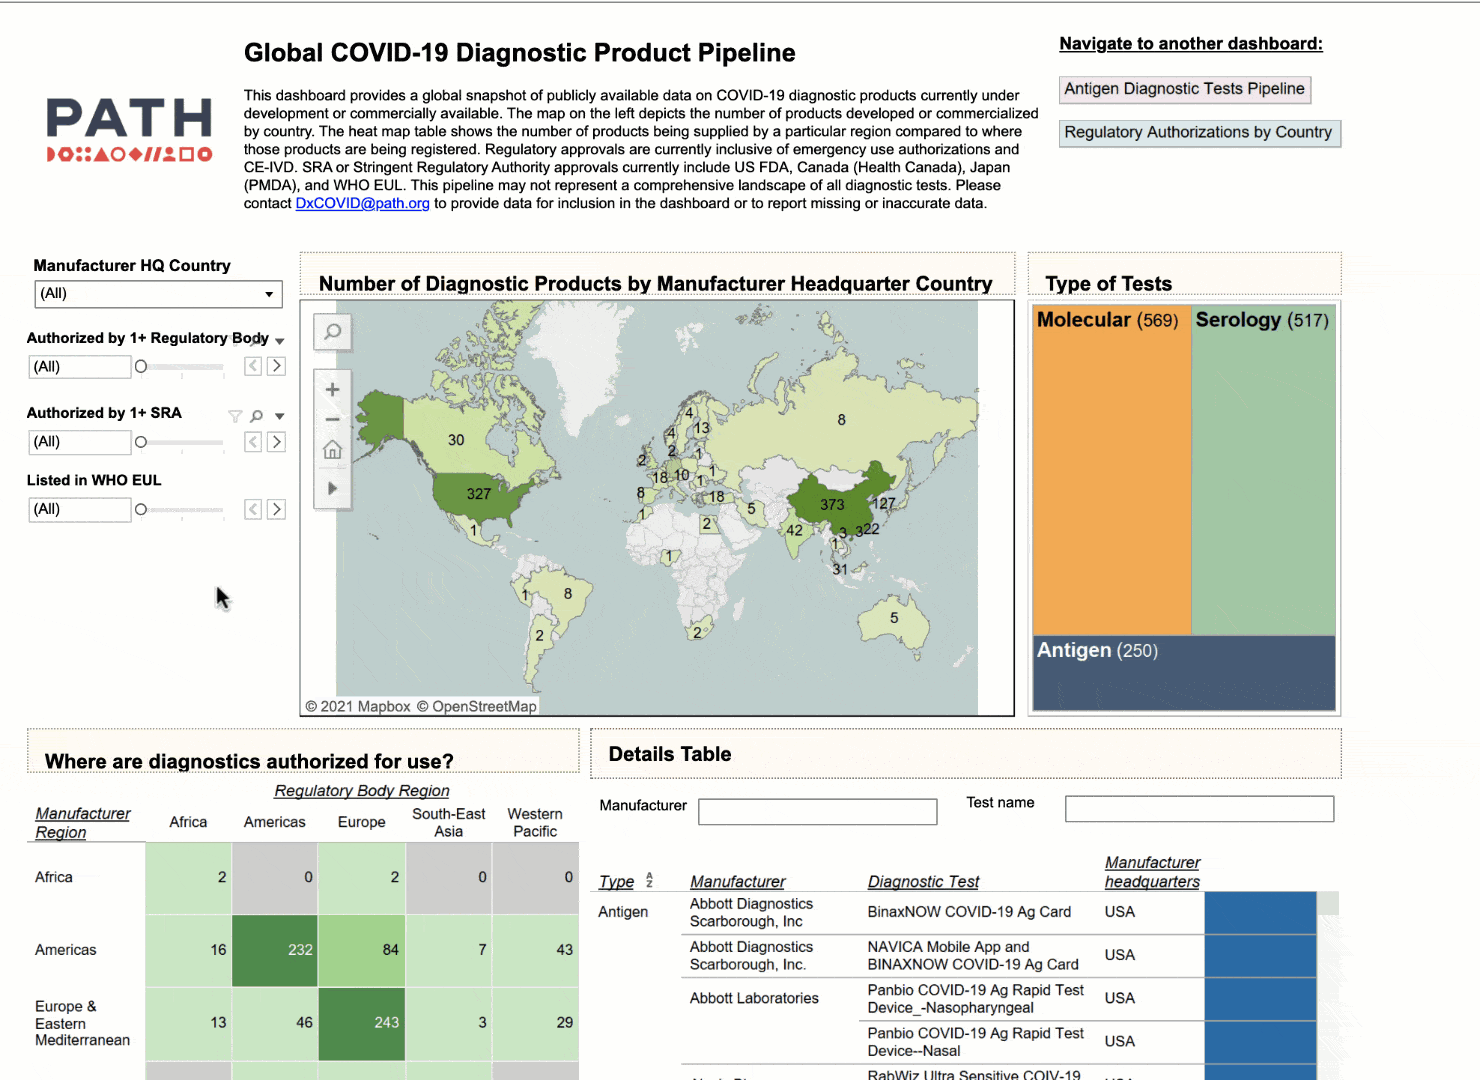
Using the interactive dashboard, public health officials can feel confident that they can make their decisions with up-to-date information.
We recently spoke to Neha Agarwal, who leads commercialization for the PATH Global Diagnostics Program, to learn more about PATH’s diagnostics dashboard, and how data is playing a role in formulating public health policy recommendations, and revealing inequities.
TABLEAU: Neha, can you share a little bit about how your work helps to improve diagnostic testing?
NEHA: Our team is responsible for developing commercially sustainable business models to improve market access for products across our R&D portfolio, and ensuring that products are making their way to the appropriate end users in low- and middle-income countries (LMICs). This includes anything from ensuring tests are affordable and priced appropriately, working with manufactures to ensure the products are registered and accessible in LMICs, aligning product attributes and their quality to the needs of the end user, and working with our country offices and partners in LMICs to to ensure there's functioning systems in place to get these diagnostics where they need to go.
TABLEAU: So this work goes beyond creating dashboards and data. You're also formulating policy recommendations.
NEHA: I think the first goal is just providing visibility into what's actually happening through the data, and then being able to use that as an advocacy tool to say, look, after analyzing the data, we’re finding inequities, which are indicative of certain market failures—and so being able to leverage our networks and our experience to help shape a better market for those diagnostic products.
TABLEAU: Can you describe the use case for this particular dashboard? Clearly, public health officials are using it to inform their understanding of what's available to them.
NEHA: I think that there are multiple use cases that we intended with this dashboard. I think you nailed the first and the most important one to us, which is to provide visibility to which diagnostics are coming to the market, which diagnostics have already been commercialized and where they are available. At PATH we really emphasize the need for quality products, not just any product, and so we have a way for health officials to look and compare diagnostics based on their performance. So if they don't have any high quality diagnostics that are available to them immediately, at least they have a short list of products that are.
But we also hope diagnostic manufacturers see utility in this data in being able to understand where gaps exist and where the current diagnostic deserts are. They could use the dashboard to inform their market strategies around growth opportunities and new markets. And that would be a huge win for us if that helped shape some of their market access strategies.
TABLEAU: You said that 70% of the users are outside of the US. What is the regional breakdown and, what other regions would you like to see usage increase?
NEHA: Yeah, great question. Our biggest user base outside of the US is actually India. If we exclude India, there's a lot of use in Europe, in Asia, and Southeast Asia as well. China, too; that's a huge manufacturing base for diagnostics. I think we have over 100 unique countries that have logged in at some point to use the dashboard.
To answer your second question, we would love to see more use in South America and Africa, regions that currently have what appears to be the biggest supply and registration gaps. We are expanding and updating the tool monthly and would appreciate collaborating with partners in these regions to include more data on local availability and registration of products.
TABLEAU: You spoke about the diagnostic deserts and how data like this can help address equity and access issues.
NEHA: We saw over the summer that the US and Europe were rapidly entering into supplier agreements with COVID diagnostics manufacturers. And I immediately thought this is going to be a seller's market. And what does that mean? That means that many countries are going to be priced out. And so really, this tool, it’s not so much focusing on the technical performance of diagnostics, for which there are several other very impressive dashboards, but it's really trying to illuminate this other big problem around inequity and the fact that there are real supply security issues for diagnostic products in addition to vaccines. If we can at least identify where the issues are prevalent and show accompanying data to support it, then we have an evidence-based starting point to begin tackling some of those problems.
To learn more about how organizations are using Tableau and the power of data to navigate the pandemic, visit the COVID-19 Data Hub.
Storie correlate
What we can learn from open data: COVID-19 in the Netherlands
 29 Aprile, 2021

After a year of COVID-19 charts, eight data communication lessons learned
 19 Aprile, 2021
Crowdsourced COVID-19 vaccine data helps those with serious medical conditions
 19 Marzo, 2021