Dashboard Design: Tiled vs. Floating Layouts


Note: The following is a guest post by Tableau Ambassador David Pires.
I recently heard a number of voices I respect advocating for the use of floating layouts all the time. Yes, you read that right: Going 100% floating; not just floating your logo in the corner or some bit of text, but the whole thing. (I know, I was stunned, too.)
I have floated a few objects in my dashboards in the past. For instance, my Iron Viz entry had quite a few floating objects.
But up until a few weeks ago, I was really just scratching the surface. Then, while working on a Makeover Monday viz on the US death penalty, I decided to go all out and try and create a fully-floating dashboard. Here's the final result:

This appraoch probably took me a little longer because I had to get my brain in the floating swing of things.
But here are three of my takeaways from experimenting with floating objects And as I use it more, I’m sure I’ll find others as well.
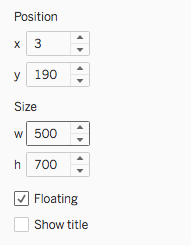
Precision sizing: In floating mode, Tableau allows you to define nor only the size of the object but also the exact position. This can be extremely useful when trying to align content in a dashboard. I’m extremely picky with this and have spent many minutes making sure all my dashboards align correctly.
Reorder position: Similar to PowerPoint or any layered-image manipulation software, Tableau's floating mode allows you to control the order of each of the elements in the dashboard. Simply drag the objects to place them in the order you want.
Overlay graphics: The ability to overlay the charts or images is the essence of the floating layout. We can make better use of the space around the charts we’ve created, as was the case with the viz below. Here I’m using the chart plus two images overlaid on top of the circle.

So? Floating or Tiled?
While looking for information about floating, I came across this post by Nelson Davis. He tested the performance of tiled versus floating dashboards and found that floating dashboards work faster. Though Nelson wrote the post back in 2014 and Tableau has improved a great deal since, his tips are still worth bearing in mind.
On the other hand, here’s a Tableau tip from Andy Kriebel on creating long-form dashboards, Andy uses a tiled approach and shares some great tips.
As a final thought, if you are taking the first steps using Tableau, I’d say it will be worth your time to know how to work with both tiled and floating dashboards. It would make you a more competent user. And you can decide when to use each of the methods, depending on the end result you are looking for.
For more tips, ideas, and vizzes by David, check out his Tableau Public profile page and his blog. You can also connect with him on Twitter @davidmpires.
Storie correlate

Iron Viz 2026: Read Between the Data
 28 Maggio, 2026

Tableau's Iron Viz Winners

Explore the 2026 Iron Viz Entries
 15 Dicembre, 2025