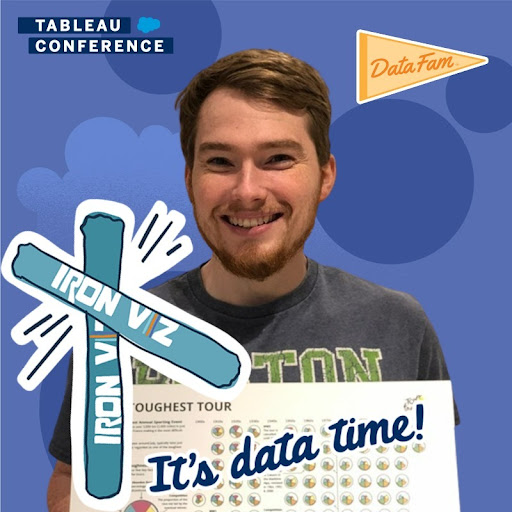
Meet Tableau’s 2022 Iron Viz Finalist Will Sutton


As the clock ticks closer to the Iron Viz Championship we will be getting to know our top 3 contenders in this "Meet the Iron Viz Finalists" series where you'll get to learn a little more about them and gain a sneak peek into what it took for them to get here. The Iron Viz Championship is only a few weeks away. We can’t wait to witness the ultimate data competition at Tableau Conference and see whose visualization will reign supreme. Our three 2022 finalists, CJ Mayes, Kimly Scott, and Will Sutton, out vizzed hundreds of amazing “Visualizing the Arts” Iron Viz qualifier submissions and explored what’s possible on Tableau Public.
Will Sutton has been using Tableau since 2014 and published his first visualization on Tableau Public in 2015. Since then, he’s not only revamped his first visualization but has continued to use Tableau Public, founded a Tableau Community Project, and is speaking in a TC22 virtual session.
So excited to have you join us, Will. This is your second time entering Iron Viz. What are some things you’ve learned since you’ve entered?
There are three core principles I have with this competition that this year really reinforced for me. The first is to take a question or topic that interests you and run with it. The second is to try something new. And last—be bold.
Since last year I've learned a great deal about incorporating different charts along with Tableau's functionality like parameter actions to create a more personalized story for the user.
Tell us more about your 2022 qualifier entry. Did you know right away what art-related topic you would analyze? Did you already have a data set in mind or have to look around? What made you choose this topic?
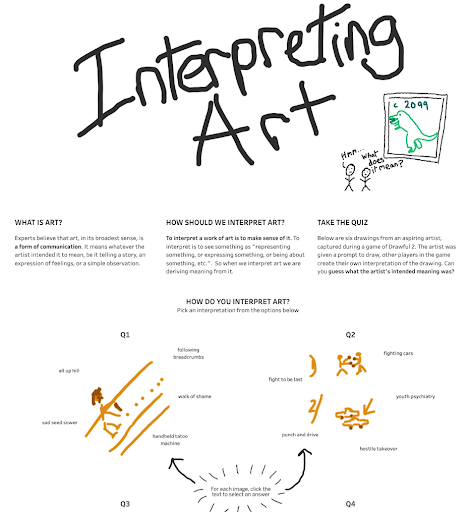
I had a few different ideas that I was considering, but the topic I went with was the one that made me smile and laugh the most—a dive into the game Drawful 2. I figured it would be an enjoyable project regardless of the outcome.
To start with, I just had a few Pictionary images and the answers. So no dataset existed—I had to make my own. I created a Google Form and asked users to guess which answer best suited the image. Fortunately, members of the Tableau Community on Twitter were very supportive, and shared it widely so I had plenty of data to work with.
Compared to your earlier approach to data visualization to your qualifier entry, where would you say you’ve most improved?
I feel the real difference is the user interaction and storytelling. For an Iron Viz dashboard, users will spend more time on them than on a typical social media post which means you delay certain aspects to be revealed later for more impact from a storytelling perspective. Knowing this, I left all the data off-screen until the user completed the quiz.
Using the input data (via parameters), you can weave that user into the story, creating a personalized experience. For example, it's more interesting for the user to say "you thought the answer was X and 20% of respondents agreed with you" rather than "20% of respondents for the answer was X". This was then re-enforced with a standard color throughout the viz.
.
Do you think the Tableau Community has helped you along your Iron Viz journey into becoming a finalist? In what ways has the DataFam supported you?
Absolutely, for a start, I wouldn't have any data for my feeder viz—big thank you again to all the respondents.
There's a huge knowledge base in the community. I certainly don't know how to do everything with Tableau, but there are so many tips, tutorials, and templates available that make all your ideas possible with Tableau. We're all grateful to those that take the time to share their knowledge!
You’re an active Community Project leader for Games Night Viz and participated in numerous other community projects. You’ve also been selected as Tableau Public’s Viz of the Day multiple times—what about these parts of the Tableau Community keep you coming back?
The Tableau Community is just such a supportive network, and there's so much enablement to help you progress your skills at any stage. Last year I started the Preppin’ Data challenges to help me learn Python, which is a valuable skill for data projects and my career. Similarly, I explored many community projects and datasets to hone my skills in visualization. We're really spoiled for choice with the number of projects and topics available.
The community is also there if you need help or feedback, big shoutout to Tableau Public Ambassador Michelle Frayman and Tableau DataDev Ambassador and Visionary Zak Geis' #VizOfficeHours for people in the community to drop in and get feedback on a viz they're working on.
Thanks for connecting with us, Will. We can’t wait to see you on the big stage at Tableau Conference. For our last question—what are you most excited about the Iron Viz championships and TC22?
It'll be my first in-person conference, so I'm excited to meet all the great people in the community. I'm also looking forward to Kimly and CJ's vizzes. They're two very talented people, and it's a tough dataset, so I'm super interested to see how they've tackled it!
Want to know more about the other finalists too? Learn all about Kimly Scott, CJ Mayes, and see all things Iron Viz right here.
Articles sur des sujets connexes

Iron Viz 2026: Read Between the Data
 mai 28, 2026
Top 10 Qualifiers for Iron Viz 2026
