 Tips & Techniques
A Guide to Mapping and Geographical Analysis in Tableau
 novembre 15, 2024
Learn the basics of mapping in Tableau, how to create maps, use layers, area calculations, and other mapping features from Tableau Visionary Marc Reid.
novembre 15, 2024
Learn the basics of mapping in Tableau, how to create maps, use layers, area calculations, and other mapping features from Tableau Visionary Marc Reid. Tips & Techniques
How To Get Your Fitness Data Ready For Tableau
 novembre 3, 2024
A step-by-step guide to prepping your Apple Health fitness data for Tableau.
novembre 3, 2024
A step-by-step guide to prepping your Apple Health fitness data for Tableau. Tips & Techniques
How to Use the Intersects() Calculation in Tableau
 mars 27, 2023
Learn about the Intersects calculation in Tableau, which allows you to find spatial intersections via calculated fields at the workbook level—rather than in a join.
mars 27, 2023
Learn about the Intersects calculation in Tableau, which allows you to find spatial intersections via calculated fields at the workbook level—rather than in a join.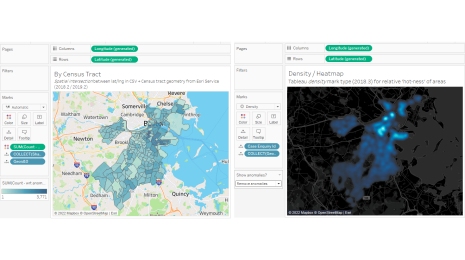 Tips & Techniques
How to Find Patterns and Anomalies Using Spatial Data Distributions
 septembre 29, 2022
Explore how spatial data distributions in Tableau help us find patterns in our data—and problems in the underlying data set.
septembre 29, 2022
Explore how spatial data distributions in Tableau help us find patterns in our data—and problems in the underlying data set. Tips & Techniques
6 tips for creating charts for social media
 avril 16, 2022
Tips and tricks on how to design charts and visualizations to share in social media.
avril 16, 2022
Tips and tricks on how to design charts and visualizations to share in social media. Tips & Techniques
Best practices for building effective dashboards
 octobre 5, 2021
Learn tips for building effective dashboards for your audience. adding metrics and relevant information to support data-driven decisions.
octobre 5, 2021
Learn tips for building effective dashboards for your audience. adding metrics and relevant information to support data-driven decisions. Tips & Techniques
The do’s and don’ts for building a dashboard
août 31, 2021
Learn about some of the best practices for building an actionable and informative data analytics dashboard.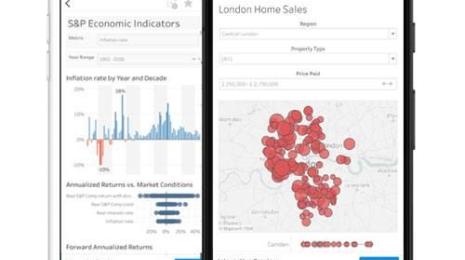 Tips & Techniques
5 tips for mobile-first dashboard design in Tableau
 décembre 3, 2019
Tableau Visionary Ryan Sleeper shares his tips for creating mobile-first dashboards in Tableau, including how to: determine if you should consider a mobile-first design, scroll multiple sheets at once and eliminate default scroll bars completely, leverage tooltips, and more.
 Tips & Techniques
10 calculs de table Tableau incontournables
novembre 22, 2019
Voici 10 exemples éloquents de calculs de table Tableau. La plupart ne nécessitent qu'une formule simple. Chaque exemple présente des données en direct et des instructions dans une vue à onglets. Vous pouvez télécharger tous les classeurs pour observer les détails à votre guise.
 Tips & Techniques
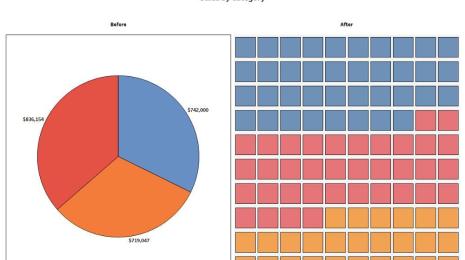
5 alternatives to pie charts
Before you bake another pie chart, consider these 5 alternative ways to visualize your data.
 Tips & Techniques
7 conseils et astuces des spécialistes des tableaux de bord
octobre 19, 2017
Vous créez des tableaux de bord pour vos collègues ? Inspirez-vous de nos meilleurs exemples pour vos propres créations.
 Tips & Techniques
10 astuces pour créer différents styles de carte dans Tableau
 novembre 23, 2016
Découvrez ces astuces pour créer différents styles de carte dans Tableau