Tous les articles de
 Enterprise
Five surefire ways to get value from your IoT data today
 octobre 30, 2017
With the rise of low-cost sensors, ubiquitous connectivity, and massive data volumes, the “Internet of Things” promises to change the world. Don’t let data challenges get in the way.
octobre 30, 2017
With the rise of low-cost sensors, ubiquitous connectivity, and massive data volumes, the “Internet of Things” promises to change the world. Don’t let data challenges get in the way.
 Developer
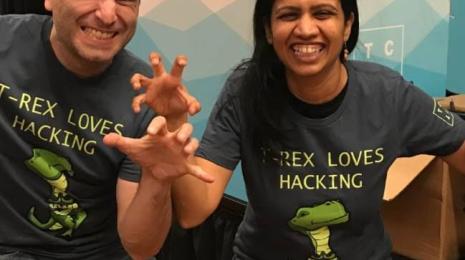
Highlights from the Las Vegas #DataDev hackathon at TC17
octobre 27, 2017Miss the #DataDev hackathon at Tableau Conference? We're sharing highlights on the blog.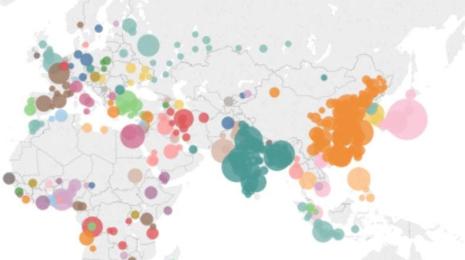 Data Skills
Enhance your presentation with Tableau
 octobre 26, 2017
Learn how to enhance your presentation with Story Points.
octobre 26, 2017
Learn how to enhance your presentation with Story Points.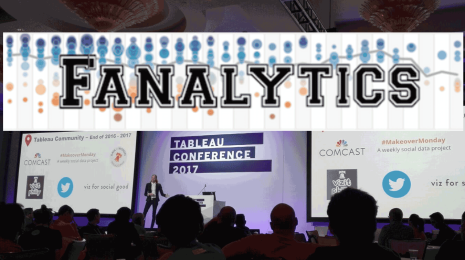
 Visualizations
Explore the viz that reigned supreme at Iron Viz 2017
 octobre 23, 2017
Explore the viz that reigned supreme at Iron Viz 2017.
octobre 23, 2017
Explore the viz that reigned supreme at Iron Viz 2017. Enterprise
Three reasons your business intelligence adoption has stalled
 octobre 20, 2017
Digital transformation and the need to foster a data-driven culture fueled by analytics is a top priority for organizations. But is your approach to business intelligence not catching on? Here are three reasons why.
octobre 20, 2017
Digital transformation and the need to foster a data-driven culture fueled by analytics is a top priority for organizations. But is your approach to business intelligence not catching on? Here are three reasons why.
 Tips & Techniques
7 conseils et astuces des spécialistes des tableaux de bord
 octobre 19, 2017
Vous créez des tableaux de bord pour vos collègues ? Inspirez-vous de nos meilleurs exemples pour vos propres créations.
 Data Skills
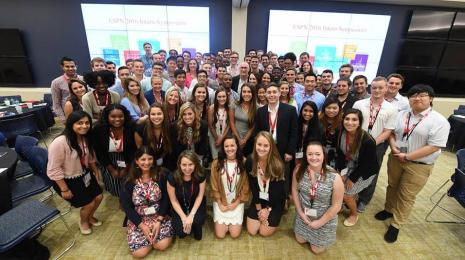
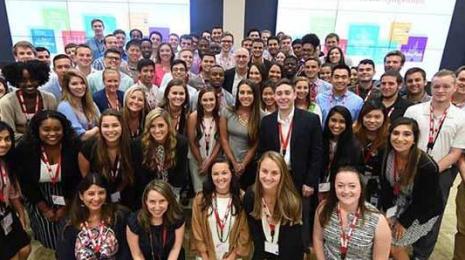
Generation Data: Tableau vizzes impress ESPN, lead to internship
octobre 18, 2017
We sat down with Tejal Narkar, recent graduate of the University of Texas at Dallas to discuss how ESPN uses Tableau.
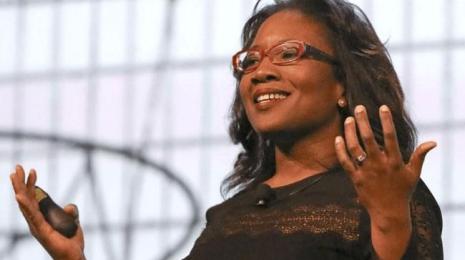 Tableau Community
Three things we learned from Dr. Talithia Williams and the Data + Women panel
 octobre 17, 2017
Three things we learned from Dr. Talithia Williams and the Data + Women panel
octobre 17, 2017
Three things we learned from Dr. Talithia Williams and the Data + Women panel

