Tous les articles de
 Tableau Public
Results: IMDA-Tableau NIC Face-Off | Community-Driven Data Stories Competition 2017
 novembre 22, 2017
 Data
DataHow analytics can supercharge holiday retail sales
 novembre 21, 2017
Thanksgiving weekend kicks off the holiday shopping season in the United States. And once more, retailers will compete for a share of consumers’ gift purchases.
novembre 21, 2017
Thanksgiving weekend kicks off the holiday shopping season in the United States. And once more, retailers will compete for a share of consumers’ gift purchases. Tableau
Découvrez notre liste des tendances de la BI pour 2018
 novembre 15, 2017
Pour vous aider à bien démarrer la nouvelle année, nous avons interrogé nos meilleurs spécialistes et compilé une liste des 10 grandes tendances de la BI à ne pas manquer en 2018. Nous avons gardé celles qui sont les plus susceptibles de se concrétiser d'après les réponses de nos équipes talentueuses, des ingénieurs aux chefs de produit.
novembre 15, 2017
Pour vous aider à bien démarrer la nouvelle année, nous avons interrogé nos meilleurs spécialistes et compilé une liste des 10 grandes tendances de la BI à ne pas manquer en 2018. Nous avons gardé celles qui sont les plus susceptibles de se concrétiser d'après les réponses de nos équipes talentueuses, des ingénieurs aux chefs de produit.
 Tableau Cloud
Calling all Cloud customers and enthusiasts! What to expect at AWS:reInvent 2017
 novembre 15, 2017
Tableau is excited to partner with AWS at their annual Customer and Partner Conference, AWS re:Invent, which will happen in Las Vegas November 27 - December 1, 2017.
novembre 15, 2017
Tableau is excited to partner with AWS at their annual Customer and Partner Conference, AWS re:Invent, which will happen in Las Vegas November 27 - December 1, 2017.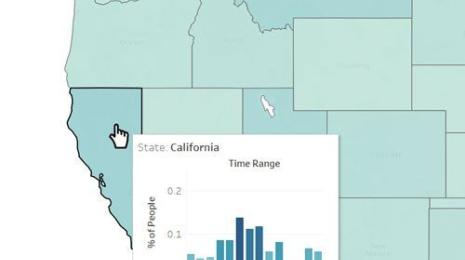 Product
Viz in Tooltip is here!
 novembre 15, 2017
In our upcoming Tableau 10.5 release, we’re proud to deliver on our promise of hosting incredible visualizations in tooltips. Not only is this feature an engaging form of viz interactivity, it’s also a fantastic way to augment your dashboards and stories with relevant data without introducing more clutter.
novembre 15, 2017
In our upcoming Tableau 10.5 release, we’re proud to deliver on our promise of hosting incredible visualizations in tooltips. Not only is this feature an engaging form of viz interactivity, it’s also a fantastic way to augment your dashboards and stories with relevant data without introducing more clutter. Enterprise
The 5 phases of today’s analytic workflow
 novembre 10, 2017
A modern analytics approach is critical to glean beneficial data insights
novembre 10, 2017
A modern analytics approach is critical to glean beneficial data insights
 Enterprise
IT increase adoption and scale Tableau across Daimler
 novembre 7, 2017
We asked Benjamine from Daimler AG to share his learning and tips around implementing an enterprise-wide Tableau deployment.
novembre 7, 2017
We asked Benjamine from Daimler AG to share his learning and tips around implementing an enterprise-wide Tableau deployment.
 Best of Tableau Web
Best of the Tableau Web: Beautiful pi charts and dashboard design thinking
 novembre 3, 2017
The end of October has come and gone— which means it’s time for another Best of the Tableau Web!
 Tableau Cloud
Announcing support for Amazon Redshift Spectrum (external S3 tables) in Tableau 10.4!
novembre 2, 2017
We're excited to announce support for Amazon Redshift Spectrum (external S3 tables) in Tableau 10.4!
