Zu den weiteren Angeboten
Tableau Software
  • Produkte
    • Produktübersicht
    • Tableau Desktop
    • Tableau Prep
    • Tableau Server
    • Tableau Online
    • Tableau Data Management
    • Tableau Server Management
    • Tableau Mobile
    • Eingebettete Analytics
    • Entwicklertools
    • Neueste Versionen
    • Preise
    • Jetzt kaufen
  • Lösungen
    • Übersicht Lösungen
    • Branchen
    • Abteilungen
    • Funktionen
    • Technik
    • Visualisierungsgalerie
    • Enterprise IT
    • Kundenberichte
  • Schulungen
    • Übersicht Schulungen
    • Erste Schritte
    • Kostenlose Schulungsvideos
    • eLearning
    • Präsenzschulungen
    • Live-Schulung
    • Whitepapers
    • Tableau Blueprint
    • On-Demand-Webinare
    • Resource Center
  • Community
    • Übersicht Community
    • Foren und Benutzergruppen
    • Tableau Public
    • Partner
    • Veranstaltungen
    • Tableau Conference
    • Tableau Conference Europe
    • TC auf Abruf
    • Hochschulprogramme von Tableau
  • Support
    • Übersicht Support
    • Desktop-Support
    • Prep-Support
    • Server-Support
    • Public-Support
    • Online-Support
    • Support für Mobilgeräte
    • Tableau-Hilfe
    • Dienstleistungen
    • Kundenportal
    • Knowledgebase
  • Über
    • Über uns
    • Mission
    • Management
    • Blog
    • Nachrichten
    • Preise und Anerkennung
    • Forschung
    • Stellenangebote
  • Preise
  • Anmelden
  • Suche
  • Jetzt testen

Stay on top of your production and losses


Teilen

Increasing production and reducing downtime are two critical goals for oil and gas production companies. And achieving these outcomes relies on an efficient supply of information.

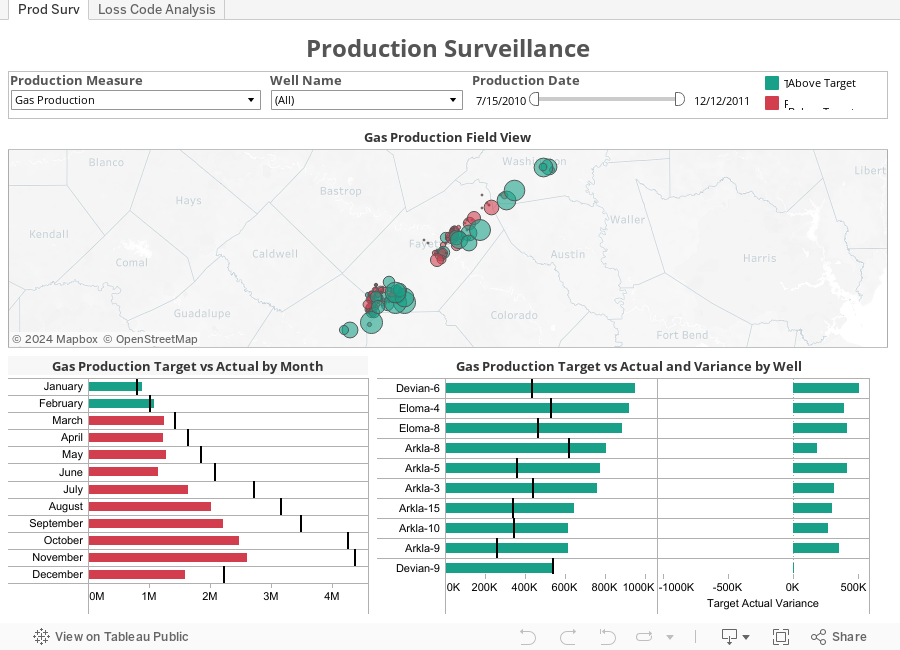
Tableau can connect with your production and downtime data in almost any format, presenting even substantial quantities of data in these two simple dashboards.

The first dashboard focuses on production surveillance. This includes an overview of your production field and a closer look at performance (target vs. actual) by month and by individual well. Clicking the second tab brings you to another dashboard that analyzes downtime losses by geography, month, well and category. Most importantly, you can customize your view using the filter panel at the top, giving you greater control over the information you want to see.

  • Themen:
  • Smart Analytics
  • Analytics im Energie- und Ressourcenbereich

Tableau Prep kostenlos ausprobieren

Kostenlose Testversion herunterladen

Deutsch
  • English (US)
  • Deutsch
  • English (UK)
  • Español
  • Français
  • Português
  • Italiano
  • 日本語
  • 한국어
  • 简体中文
  • 繁體中文
  • Systemstatus
  • Blog
  • Entwickler
  • Wissenschaft/Akademia
  • Stellenangebote
  • Kontakt
  • Impressum
  • Datenschutz
  • Deinstallieren

© 2003-2019 Tableau Software. Alle Rechte vorbehalten