Visualizing Customs Fraud in the European Union


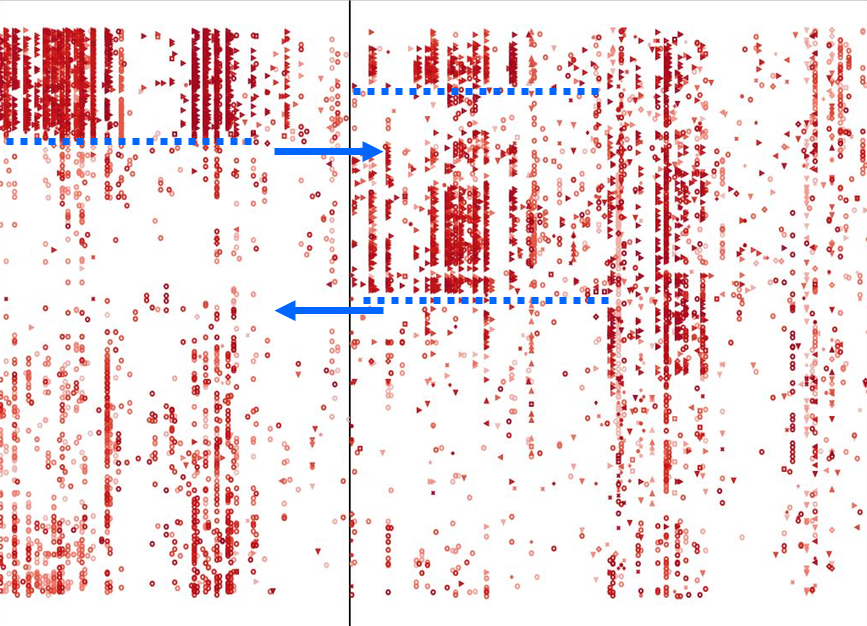 The specific examples of fraud Jürgen discusses is the misdeclaration of values or origin for textiles, which is an evasion of ad valorem duties. A scatterplot of commodities versus time helps visually cluster cases that meet certain criteria that imply fraudulent activity. Interestingly, the clusters will often - and suddenly - alternate between neighboring countries, depending on which is known to be enforcing customs regulations at the time. In his office, Jürgen proudly displays a wall-sized plotter printout of the scatterplot across all nations.
My favorite part of the presentation came when Jürgen described a request he heard from Ellie Fields, our Director of Marketing: could you show how this was visualized before Tableau? Jürgen smiled as he showed a blank PowerPoint slide, and remarked "I didn't even try - it would be ridiculous!"