Introducing Lee Wilkinson, Tableau’s New VP of Statistics


Suggested musical pairing for this introduction: This track of Lee Wilkinson playing the piano, his favorite pastime.
If anyone could’ve imagined a thing like Tableau decades ago, it might’ve been Lee Wilkinson.
Back in the ‘70s, before the Internet, Lee built his own computer using a kit “and a lot of soldering.” On that big, black box, Lee wrote a pioneering statistics program that changed the way people analyzed data.
That software package, called SYSTAT, foreshadowed some of Tableau’s best qualities.
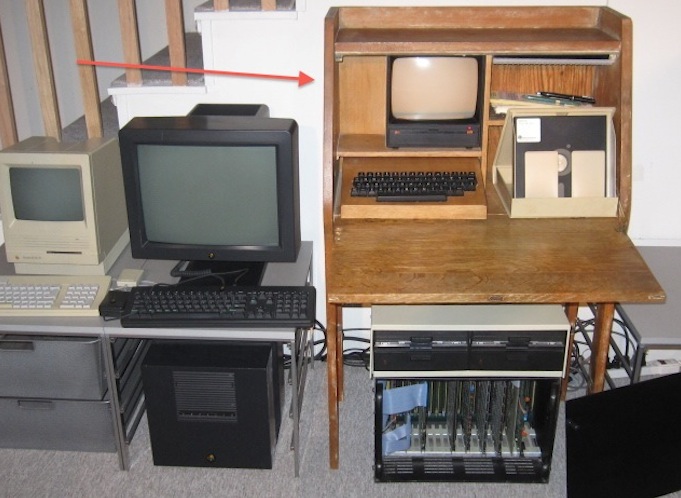
"The computer (seen right) was a kit called a Cromemco Z-2," says Lee.
A Program that Embraced How Data Explorers Think
When it hit the market in 1984, SYSTAT democratized data analysis, which had been confined to giant mainframes in labs. Suddenly anyone could analyze data without any programming skills, then visualize their findings. And perhaps most importantly, people could interact with their data and ask their own questions.
It used to be that people would define their question and input their data cards. Then the mainframe would spit out a printout—which, as Lee puts it, “is not the way that statisticians think.”
“Statisticians and most analysts think much more in the way people use Tableau today,” Lee says. “In other words, they follow a hunch, get some results, drill deeper or change their strategy, depending on what they learn about the data.”
SYSTAT came with a “lighthearted,” jargon-free manual Lee wrote himself. With it, anyone could type commands into a personal computer and play with their data. Speed to insight became much faster.
Lee founded a company by the same name, which quickly grew, as did SYSTAT’s pool of enthusiasts.
“I had about 25,000 users, and they were all sorts,” Lee says. “The Reagan White House called me and [said] they were using SYSTAT to analyze polls immediately.”
There were also unexpected use cases, including “field biologists who would go to Panama and study the sex life of spiders—I’m not making that up!” says Lee.
Because SYSTAT ran on portable computers, researchers could analyze their data in the field instead of having to wait to get back to the lab.
“I got to meet people who were very excited,” Lee says. “It was obviously at a much smaller scale than Tableau, but meeting enthusiastic users the way you see at Tableau Conference is a real thrill. You feel like you’re contributing something that makes people’s lives easier.”
How Tableau Founders Built on Lee’s Idea
Lee eventually sold SYSTAT to SPSS and joined the company while also teaching and researching statistics. In his 1999 book, The Grammar of Graphics, he outlined a system similar to Tableau’s VizQL technology, though it applied only to flat files. But that was enough to inspire Tableau co-founder and chief development officer Chris Stolte.
“Chris said, ‘How about we take some of these ideas and apply them to large databases and the way business people and analysts actually think?’ And that’s what did it,” he says.
Still, Lee says he could not have imagined that Stolte and Pat Hanrahan, Tableau co-founder and chief scientist, would execute those ideas in “such an elegant way.”
“What’s unique about Tableau, in my mind, is the absolute fluidity—the combination of ease of accessing data in the databases and the gorgeous design,” Lee says. “They took the time to make everything work right. Beautiful software is a rarity.”
Lee has been a self-described “cheerleader” of Tableau for years. But it wasn’t until he attended last year’s Tableau Conference at the behest of his employer that he felt compelled to join the company.
“It was just irresistible. There was so much enthusiasm,” he says. “It’s easy to make a little app that bounces around and does one simple thing beautifully. But to get a system the size of Tableau and to have the users be so enthusiastic? Well, you’re talking Apple, and you’re talking Tableau.”
Empowering Data Explorers to Say, ‘I’m Pretty Confident in This Result’
As Tableau’s new vice president of statistics, Lee wants to help data explorers go one step further in their analysis, to not only answer complex questions but also explain their reasoning.
Why are you forecasting an upward trend? What makes you think that’s a cancer cluster and not a random bunch of cases? However simple or complex the question, Lee wants people to be able to answer with confidence.
“Statistics is a field that protects you from making false conclusions. That’s the bottom line,” he says. “In the end, what you’re trying to do is come up with an explanation—we sometimes say stories.”
To that end, Lee is looking for ways to empower non-statisticians. He wonders whether he can fold complex models into Tableau so that it can do the heavy lifting for the user. Finding the right approach will take some time and a lot of work, he says.
In the meantime, Lee has the same hope for Tableau enthusiasts as he did for fans of SYSTAT more than three decades ago: “Go ahead and have some fun. Explore your data.”
---
Lee Wilkinson joins a brilliant team of researchers here at Tableau. Meet the rest of the research team.
เรื่องราวที่เกี่ยวข้อง

VizQL Data Service from Tableau: Use Your Data, Your Way
 สิงหาคม 8, 2024

When and How to Use Multi-fact Relationships in Tableau
 สิงหาคม 1, 2024

Top data books of 2021
 ธันวาคม 12, 2021