DataFam Roundup: May 19-23, 2025


Welcome! Dig into this week's DataFam Roundup—a weekly blog that brings together community content all in one post. As always, we invite you to send us your content—and the DataFam content from your peers that have inspired you! Find the content submission form here.
Community Highlight
To recognize new and consistent Tableau contributors—we’re excited to have a section within the weekly DataFam Roundup called the Tableau Community Highlight. Find out how to get involved.

Anastasiya Kuznetsova, Senior BI Developer at Nebius
Dubai, UAE
Anastasiya Kuznetsova is a Senior BI Developer at Nebius. Her Tableau journey began in university, where she was introduced to it as a data visualization tool. This initial exposure quickly turned into a passion, leading her to teach the same subject to first-year students after graduation, which prompted a deeper dive into the software.
She is now actively involved in the Tableau Community, valuing its open, friendly, and supportive nature, which allows for global learning and connections. Anastasia shares her knowledge and discoveries through a Sunday newsletter that curates useful materials, dashboards, and vizzes, focusing on diverse business dashboard design. She also writes about BI and data visualization, with one of her most popular posts on dashboard design principles being DataViz 101: Key Principles for Crafting Clear Dashboards. A key part of Anastasia’s learning journey has been participating in community projects such as Makeover Monday, her focus now is to share her knowledge with others through Linkedin and her newsletter.
Connect with Anastasia on Linkedin, Tableau Public, and on her website.
DataFam Content
Dive into content created by the Tableau Community:
- Bo McCready: Intentional Color Choices in Data Visualization (An Iron Viz Recap Post)
- Dawn Harrington: Layout Schmayout, Use a Tableau Template!
- Li-Lun Tu: (5 KPI Design Ideas)《Tableau 新奇》KPI也能很有美感?這5種KPI視覺化讓主管馬上點頭!| 90%分析師都忽略的視覺化關鍵心法 | Ep.42
- Johan de Groot: Responsive Labels – Smarter, Cleaner Dashboards
- Deepak Holla:
- Steve Adams:
Team Tableau Content
Visualizations
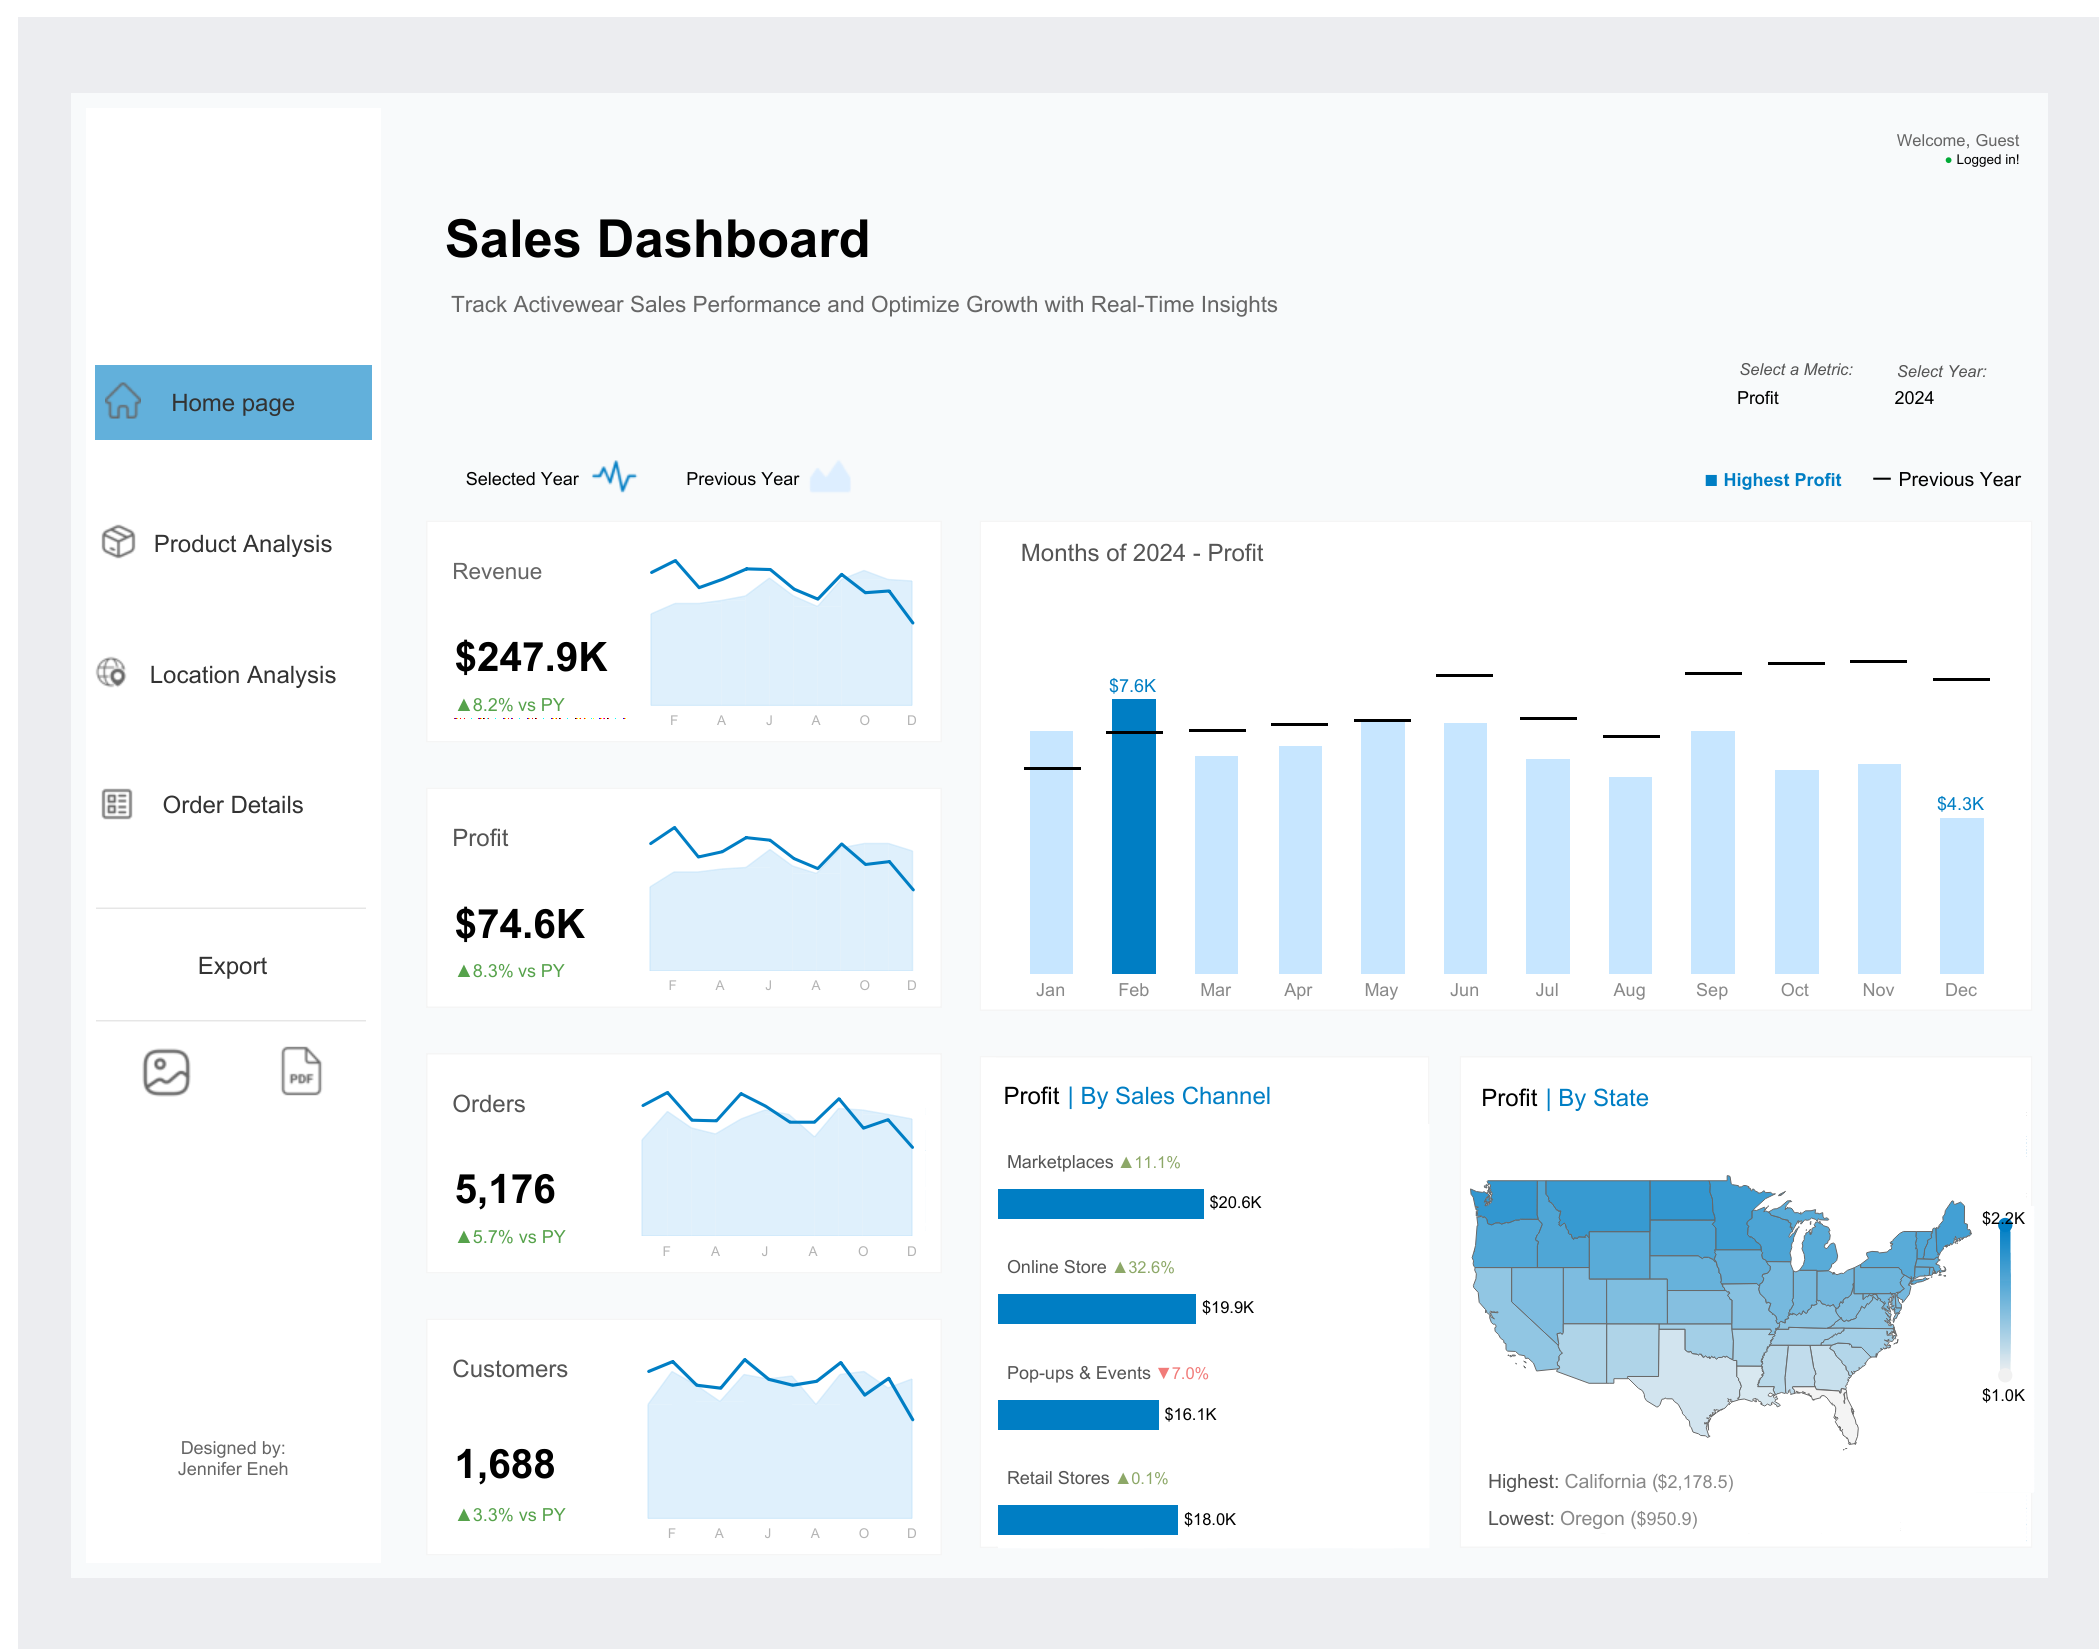
Jennifer Eneh: Sales Dashboard
See the latest Viz of the Day, trending vizzes, featured authors, and more on Tableau Public.
Check out some inspirational vizzes created by the community:
- Jeff Plattner: NBA Draft Lottery...a brief history
- Shangruff Raina:
- Ojoswi Basu:
Community Projects
Back 2 Viz Basics
A bi-weekly project helping those who are newer in the community and just starting out with Tableau. Not limited just to newbies!
Web: Back 2 Viz Basics
X: #B2VB
Workout Wednesday
Build your skills with a weekly challenge to re-create an interactive data visualization.
Web: Workout Wednesday
X: #WOW2022
Preppin' Data
A weekly challenge to help you learn to prepare data and use Tableau Prep.
Web: Preppin’ Data
X: #PreppinData
Makeover Monday
Create business dashboards using provided data sets for various industries and departments.
Web: Makeover Monday
X: #MakeoverMonday
Visual Climate
Collaborate and share climate data.
Web: Visual Climate
X: #VisualClimate
DataFam Con
A monthly challenge covering pop culture and fandoms.
Web: DataFam Con
X: #DataFamCon
EduVizzers
A monthly project connecting real education data with real people.
Web: Eduvizzers
Games Night Viz
A monthly project focusing on using data from your favorite games.
Web: Games Nights Viz
X: #GamesNightViz
Iron Quest
Practice data sourcing, preparation, and visualization skills in a themed monthly challenge.
Web: Iron Quest
X: #IronQuest
Storytelling with Data
Practice data visualization and storytelling skills by participating in monthly challenges and exercises.
Web: Storytelling with Data
X: #SWDChallenge
Project Health Viz
Uncover new stories by visualizing healthcare data sets provided each month.
Web: Project Health Viz
X: #ProjectHealthViz
Diversity in Data
An initiative centered around diversity, equity & awareness by visualizing provided datasets each month.
Web: Diversity in Data
X: #DiversityinData
Sports Viz Sunday
Create and share data visualizations using rich, sports-themed data sets in a monthly challenge.
Web: Sports Viz Sunday
X: #SportsVizSunday
Real World Fake Data
Create business dashboards using provided data sets for various industries and departments.
Web: Real World Fake Data
X: #RWFD
Data Plus Music
A monthly project visualizing the data behind the music we love!
Web: Data Plus Music
X: #DataPlusMusic
เรื่องราวที่เกี่ยวข้อง

DataFam Roundup June 2026

DataFam Roundup May 2026

Iron Viz 2026: Read Between the Data
 May 28, 2026