Create one effective dashboard that can replace several reports
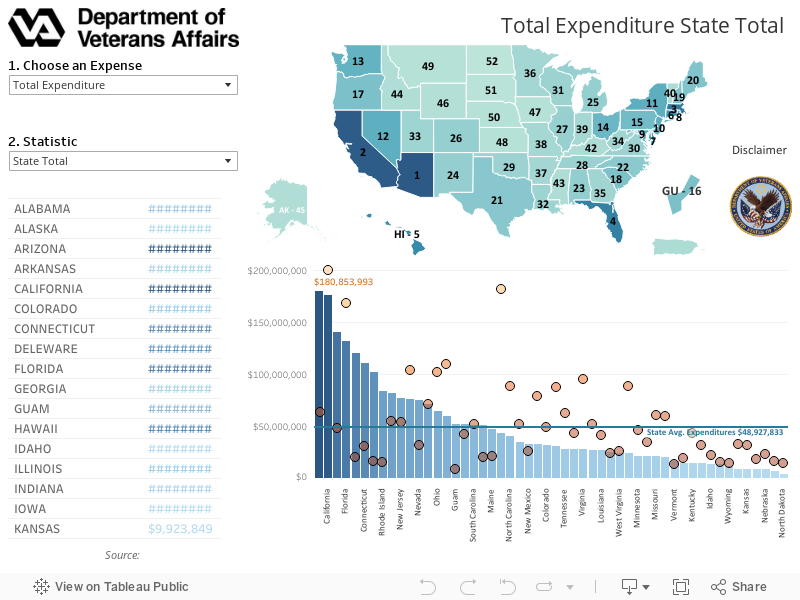
The US Department of Veteran’s Affairs used Tableau to consolidate multiple reports into a single, interactive tool, shaving months from report timelines. The team used Tableau to create a map of veteran benefit expenditures that can be viewed by state, country, or individual veteran. Now legislators can see how their state compares with others in supporting their veteran populations.