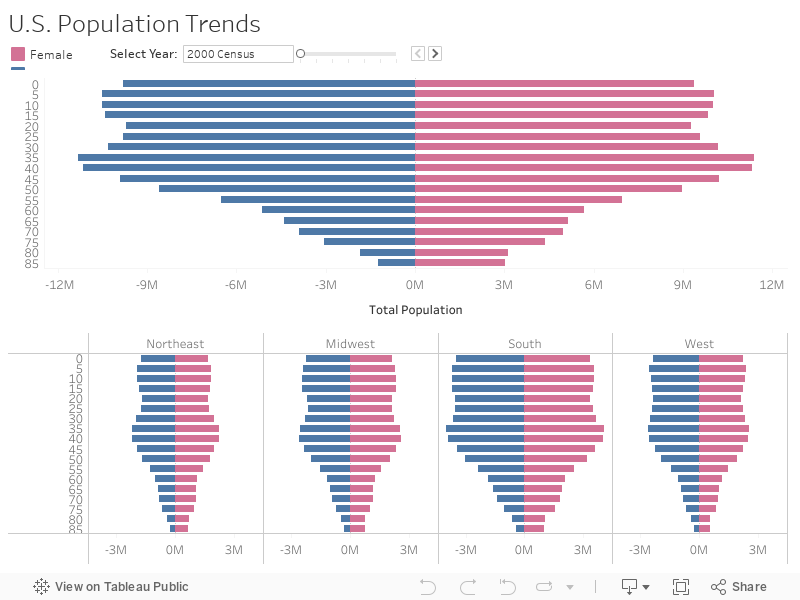
Visualize social-science data with population pyramids
The population pyramid is commonly used in demographics. In this example, it clearly tilts right, showing that women live longer than men and make up a dominant percentage of older age groups. This visual example uses bins on the age field and a simple calculation to split the genders. And by using a parameter, it also lets you select a particular year.