DataFam Roundup: October 16–20, 2023


Welcome! Dig into this week's DataFam Roundup—a weekly blog that brings together community content all in one post. As always, we invite you to send us your content—and the DataFam content from your peers that have inspired you! Find the content submission form here.
Community Highlight
To recognize new and consistent Tableau contributors—we’re excited to have a section within the weekly DataFam Roundup called the Tableau Community Highlight. Find out how to get involved.

Young Song, Postdoctoral Research Associate at Pacific Northwest National Laboratory
British Columbia, Canada
Young Song is a Postdoctoral Research Associate at Pacific Northwest National Laboratory. He was introduced to Tableau while working as a Computational Biologist where he developed Tableau dashboards that monitored the quality of sequencing data generated by laboratory technicians. Young is passionate about exploring the impact science has on our society through data visualization.
While pursuing his Ph.D. at the University of Queensland in Australia, Young got involved with the Brisbane Tableau User Group which served as a platform to share his vision for making science accessible to all. Young now uses his Tableau expertise to share his passion for science communication on Tableau Public. In the future, he hopes to continue creating vizzes that highlight the importance of microbiology and innovation in our society while capturing the changes and improvements in methods.
Connect with Young on Linkedin, X, and Tableau Public.
DataFam content
Dive into content created by the Tableau Community:
- Action Analytics: Mental Model #4: Two Understandings of Dimension
- Katie Kilroy: Tableau Desktop Resources for Newbies
-
Matthias Giger: Unlocking Data Access for Business Users in Tableau: A Step-by-Step Guide
-
Jacqui Moore, Do Mo(o)re With Data: Publishing Checklist
-
Will Sutton: Crafting a Winning Visualization: Tips from Paul Ross, Iron Viz Champ | Behind the Viz
-
Paul Liu: Replicate Salesforce Forecasts to CRM Analytics Made Easy
-
Elisa Davis: Wingspan, my IronViz ‘23 Qualifier: Part I — Elisa Davis
-
Dawn Harrington: Tableau Totals Trick
-
Sqlbelle: Dynamic Zone Visibility | Comprehensive Tableau Tutorial with 4 Practical Use Cases
-
Ed Gonzalez: TP API Examples
-
Alexander Varlamov: Global Flags | a Colorful World
-
Sekou Tyler: Ten Minute Tuesday
-
Prasann Prem: Nebula Program - Week 1
-
Dustin Schimek: #mytableaustory #datafam #data
-
OneNumber: How Tableau Table Calculations Work
-
Kevin Flerlage, The Flerlage Twins: 4 Design Techniques that I am Obsessed With
-
Andrés Quiroz Sánchez: Clase 2 Tableau Prep: unión de Columnas y calculo de Edad
-
Venkatesh lyer: How to Create Custom Categories in Tableau: RFM Analysis
-
Autumn Battani, Make It Make Sense: Getting Unstuck
-
Randy Bean, The Data Leadership Collaborative: 6 CDO Headwinds and 5 Strategies for Success
Team Tableau
Upcoming events and community participation
-
Demystifying the way to learn Data Visualization! Are you looking for a way to learn Data Visualization and feeling lost? We all have been there and I am going to help you understand the fundamentals and look for a way to learn data visualization.
-
Viz Collab: Hello everyone! I’m excited to be opening #VizCollab back up for another round of matches! In the last year I matched around 40 people for some amazing vizzes, including Viz of the Days and a viz that was featured in a local publication. So if you want to find a collaboration partner sign up.
-
Local Community Conferences by the DataFam, for the DataFam.
Vizzes
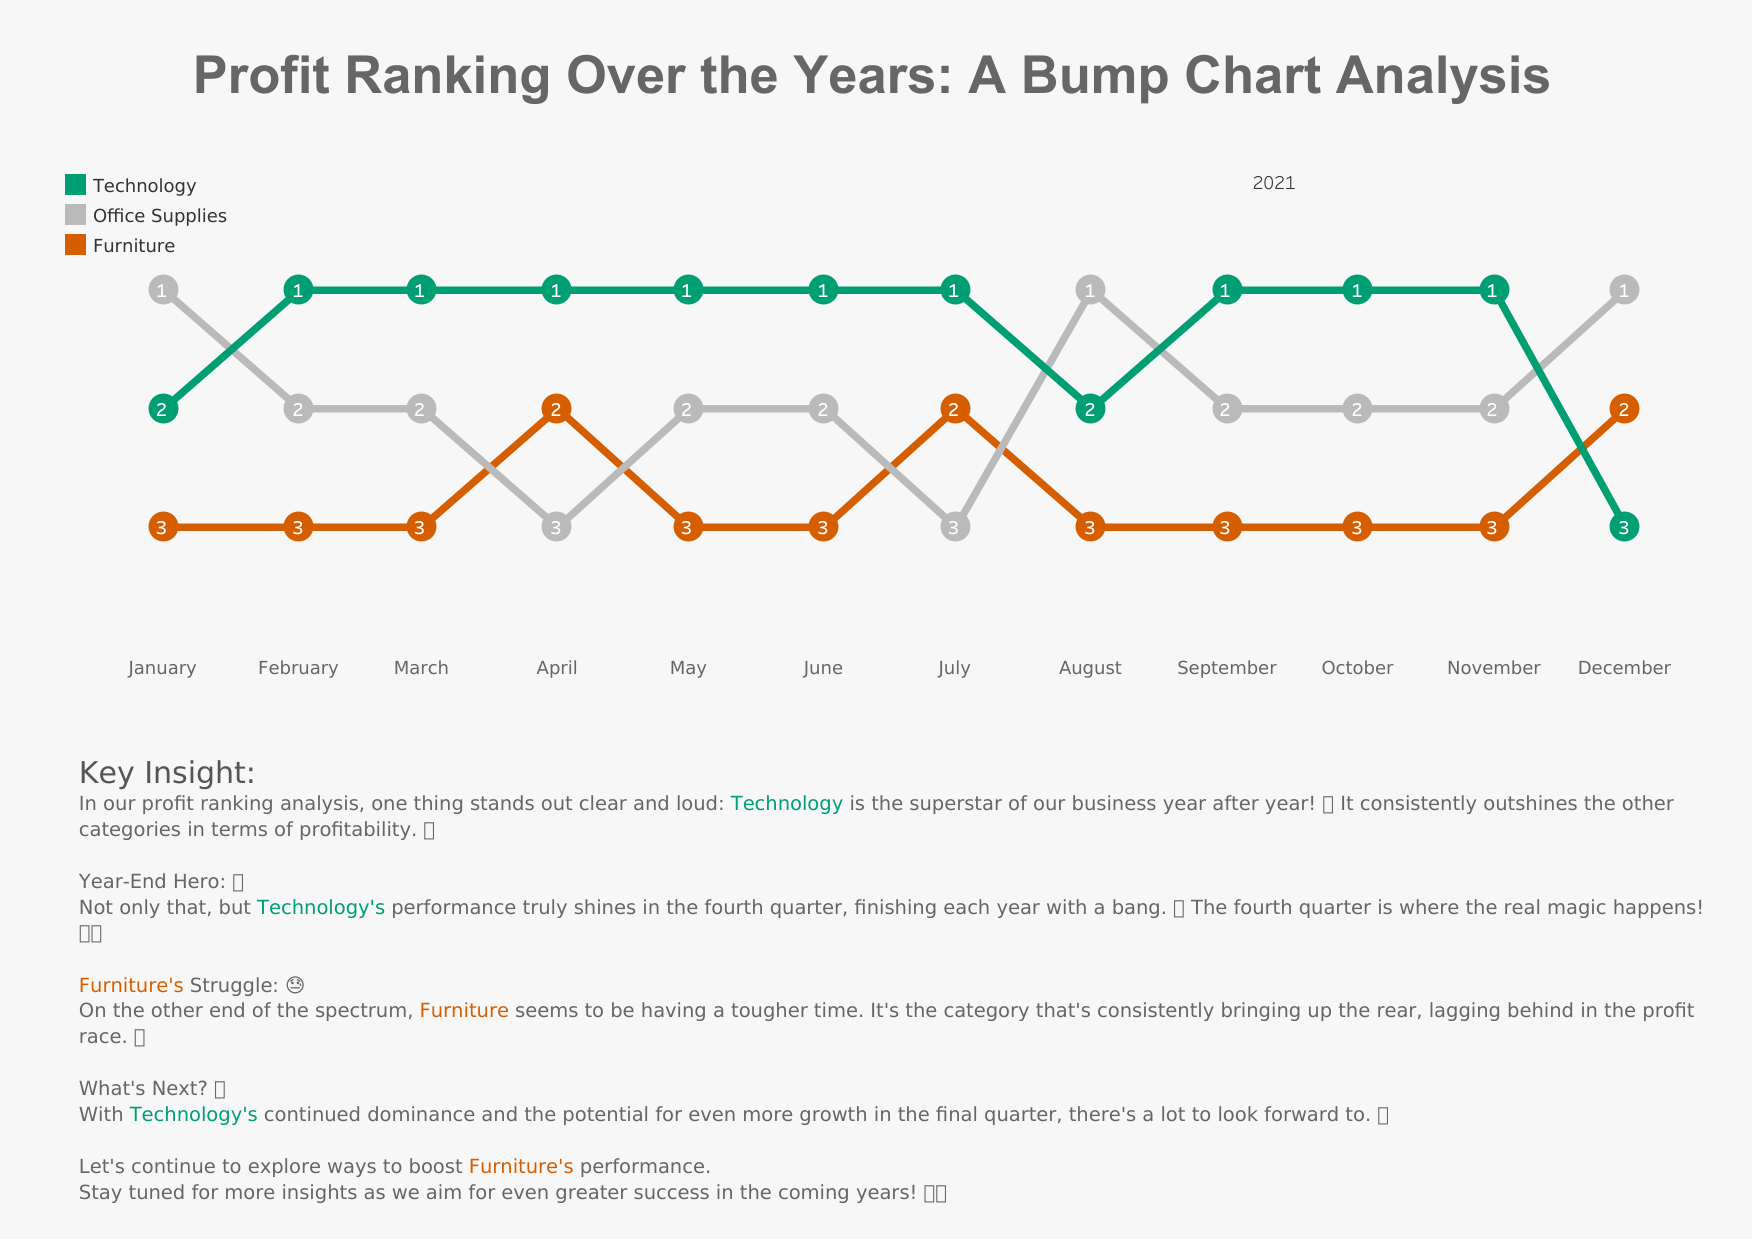
Sebastine: Bump Chart Analysis (Profit Ranking Overtime
See the latest Viz of the Day, trending vizzes, featured authors, and more on Tableau Public.
Check out some inspirational vizzes created by the community:
-
Tableau Accelerators: CORPORATE FINANCE - Budget Controlling
-
Alexander Varlamov: Global Flags | a Colorful World
-
Satoshi Ganeko: #B2VB 2023/Week 19 Choose your own chart
-
Marius Nikiforovas: Email Marketing Campaign Dashboard | #VOTD | #VizOfTheDay
-
Sebastine: Bump Chart Analysis (Profit Ranking Overtime
Community Projects
Back 2 Viz Basics
A bi-weekly project helping those who are newer in the community and just starting out with Tableau. Not limited just to newbies!
Web: Back 2 Viz Basics
Twitter: #B2VB
Week 19: Your Chart Choice
Workout Wednesday
Build your skills with a weekly challenge to re-create an interactive data visualization.
Web: Workout Wednesday
Twitter: #WOW2022
Week 42: Can you proportionally brush from multi-selection?
Makeover Monday
A weekly social data project.
Web: Makeover Monday
Twitter: #MakeoverMonday
Week 41: What are Retail Investors Interested in Buying in 2023?
Preppin' Data
A weekly challenge to help you learn to prepare data and use Tableau Prep.
Web: Preppin’ Data
Twitter: #PreppinData
Week 42: Prep School "Disco Fever"
DataFam Con
A monthly challenge covering pop culture and fandoms.
Web: DataFam Con
Twitter: #DataFamCon
September 2023: Barbie World!
EduVizzers
A monthly project connecting real education data with real people.
Web: Eduvizzers
September 2023: School Book Bans in the United States
Games Night Viz
A monthly project focusing on using data from your favorite games.
Web: Games Nights Viz
Twitter: #GamesNightViz
Season 2: Battle of the Strongest
Iron Quest
Practice data sourcing, preparation, and visualization skills in a themed monthly challenge.
Web: Iron Quest
Twitter: #IronQuest
White Space
Storytelling with Data
Practice data visualization and storytelling skills by participating in monthly challenges and exercises.
Web: Storytelling with Data
Twitter: #SWDChallenge
September 2023: makeover magic
Project Health Viz
Uncover new stories by visualizing healthcare data sets provided each month.
Web: Project Health Viz
Twitter: #ProjectHealthViz
June 2023: Funding for Research for Various Conditions and Diseases
Diversity in Data
An initiative centered around diversity, equity & awareness by visualizing provided datasets each month.
Web: Diversity in Data
Twitter: #DiversityinData
May 2023: Mental Health Awareness Month and LGBTQ+ Representation in film
Sports Viz Sunday
Create and share data visualizations using rich, sports-themed data sets in a monthly challenge.
Web: Sports Viz Sunday
Twitter: #SportsVizSunday
Viz for Social Good
Volunteer to design data visualizations that help nonprofits harness the power of data for social change.
Web: Viz for Social Good
Twitter: #VizforSocialGood
Real World Fake Data
Create business dashboards using provided data sets for various industries and departments.
Web: Real World Fake Data
Twitter: #RWFD
Session 5: Diversity Score Card
Data Plus Music
A monthly project visualizing the data behind the music we love!
Web: Data Plus Music
Twitter: #DataPlusMusic
Relaterade berättelser

DataFam Roundup June 2026

DataFam Roundup May 2026

Iron Viz 2026: Read Between the Data
 28 Maj, 2026