Vend makes Tableau its trusted source of truth
Vend now has one source of truth to manage business performance
Business Intelligence is freed up from reporting to focus on higher-value initiatives
Vend has been able to lead with certainty during the pandemic and offer support to customers most in need

Founded in 2010, Vend is a cloud-based Point-of-Sale (POS) and retail management software company that helps retailers manage and grow their business. The software is used by retailers in over 100 countries, managing inventory, and rewarding customer loyalty. The software also provides retailers with real-time reporting, helping them make smarter decisions.
Michelle Blyde, Business Intelligence Manager at Vend, shared that Vend takes a data-led approach to decision-making wherever possible, like its retailers. Blyde added, “Most of our strategic decisions are made using the data we have within Tableau. We know the data is clean, up-to-date, and can be trusted, which is imperative to our business.”
Vend first began using Tableau over four years ago. In the time since it has come to serve as the main source of truth for the company’s key business metrics. It’s also improved the timeliness and accessibility of the data used for decision-making.
Most of our strategic decisions are made using the data we have within Tableau. We know the data is clean, up-to-date, and can be trusted, which is imperative to our business.
Taking a proactive approach to business intelligence
Vend’s Business Intelligence (BI) team is responsible for enabling management and other key stakeholders with data to make decisions and manage performance. Initially, the team used Tableau to generate dashboards and insights on-demand, reacting to requests from stakeholders.
However, the approach meant that decision-makers lacked access to information like finance KPIs. It also meant the BI team was spending a lot of their time on reactive reporting instead of working on higher-value initiatives.
Vend decided to create one key metric dashboard for all stakeholders, which was refreshed daily, making data accessible near real-time. This includes finance, sales, customer, and data pulled in from Chargify, Salesforce, and Vend’s own software.
“In the past, each team had their own dashboards and reports, and there were disagreements about which numbers were correct. Tableau has helped us solve that problem by establishing one source of truth everyone can use to monitor business performance,” said Blyde.
The key metric dashboard makes it easy for users to visualise performance. They can also use filters to drill down into the details and get a better sense of what’s happening behind the numbers. This level of self-sufficiency is built into dashboards created by the BI team, so users can explore their own data and have confidence in what the numbers are telling them.
In the past, each team had their own dashboards and reports, and there were disagreements about which numbers were correct. Tableau has helped us solve that problem by establishing one source of truth everyone can use to monitor business performance,
Leading through change with data-driven decisions
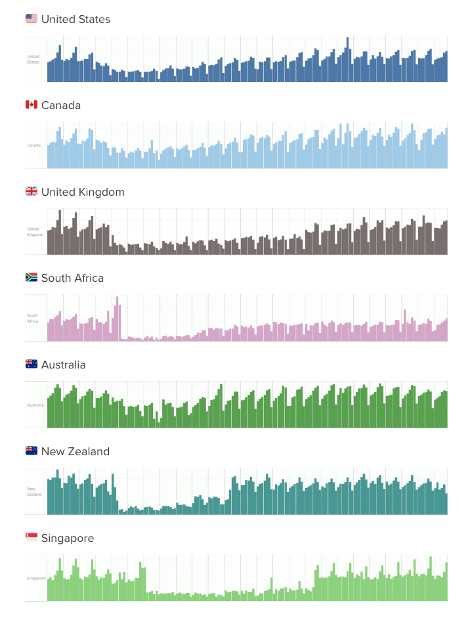
The COVID-19 pandemic created a lot of uncertainty for Vend and its customers, and the company has had to lean into its data to monitor and minimise the impacts. A set of COVID-19 dashboards was created early on to help Vend understand what was happening in each market and make data-driven decisions, rather than relying on gut feel. For instance, it was able to identify retailers who needed support and forecast the financial impacts of providing fee relief.
Hannah Bartley, Commercial Analyst at Vend, said, “With Tableau, we’ve been able to easily track things like which retailers are in lockdown and which are open, but experiencing much lower turnover. We’ve then used this data to provide coupons and relief to those who’ve needed it the most.”
Equipped with these insights, Vend has been able to navigate the pandemic with greater confidence. It’s also built up goodwill with customers while carefully managing the risks of the business.
Tableau helped us navigate the effects of the pandemic on our retailers in a clear and concise manner with all available metrics in one place.
With Tableau, we’ve been able to easily track things like which retailers are in lockdown and which are open, but experiencing much lower turnover. We’ve then used this data to provide coupons and relief to those who’ve needed it the most.
Evolving the data culture
The adoption of Tableau has grown with a number of employees proactively requesting access to view the key metrics dashboard and others. There’s also more collaboration around data, with teams having frequent conversations using the data presented in Tableau.
“I think there was a real desire before to collaborate around data, and we can do that now. We can come together in our weekly meetings and ask questions of our data, like how’s our gross revenue tracking and what’s happening with customer churn,” said Bartley.
The next step in Vend’s data journey is to increase the amount of real-time data flowing into Tableau so that it can get an up-to-the-minute, 360-degree view of its customers, including financial and product data.
“The more information we have, the more we can understand our customers and drive positive outcomes for them and the business,” said Blyde.