
Leading workforce management technology provider Papaya Global re-imagines the global payroll experience using Embedded Analytics
Supported Papaya BI usage growth by 10x increase in active users
Provided intuitive, personalized, and rewarding customer experience
Helped customers deliver more agile people, payroll, and payments solutions
Re-defining the payroll experience
Papaya Global is serious about business intelligence (BI). This Israel-based unicorn startup focuses on global payroll solutions and was recently valued at $3.7 billion. Papaya launched Tableau in 2020 to drive a better user experience to their hundreds of customers, including Toyota and Microsoft. The organisation has since multiplied their active users 10-fold and developed embedded dashboards on everything from payroll and HR analytics, to gender and pay equity. The PapayaBI product became a significant competitive advantage of the Papaya Global Platform offering with unmatched value in the market. Multiple initiatives are now being deployed to further expand and enrich the PapayaBI product.
People, payroll, and payments in one single platform
Papaya Global enables organisations to connect their workforce and payroll management onto a single global platform. Available worldwide, Papaya has $3 billion in payroll under management and more than 700 customers.
Payroll devours data. Every process – including people management, compliance, meeting in-country legal jurisdictions – creates vast volumes of data. Papaya reimagines these processes, introducing AI, automation, and other modern technologies to ensure high security standards, accurate compliance and fast, streamlined payroll processing.
Reporting is an equally vital asset in the payroll process. Organisations need to consolidate payroll analytical data in support of agile, trusted decision-making among finance, HR, and billing teams – all with custom permissions and controls. However, reporting is rarely straightforward: In most organisations, global payroll data is locked away in fragmented, siloed sources, making it more difficult to deliver timely, accurate payroll reporting.
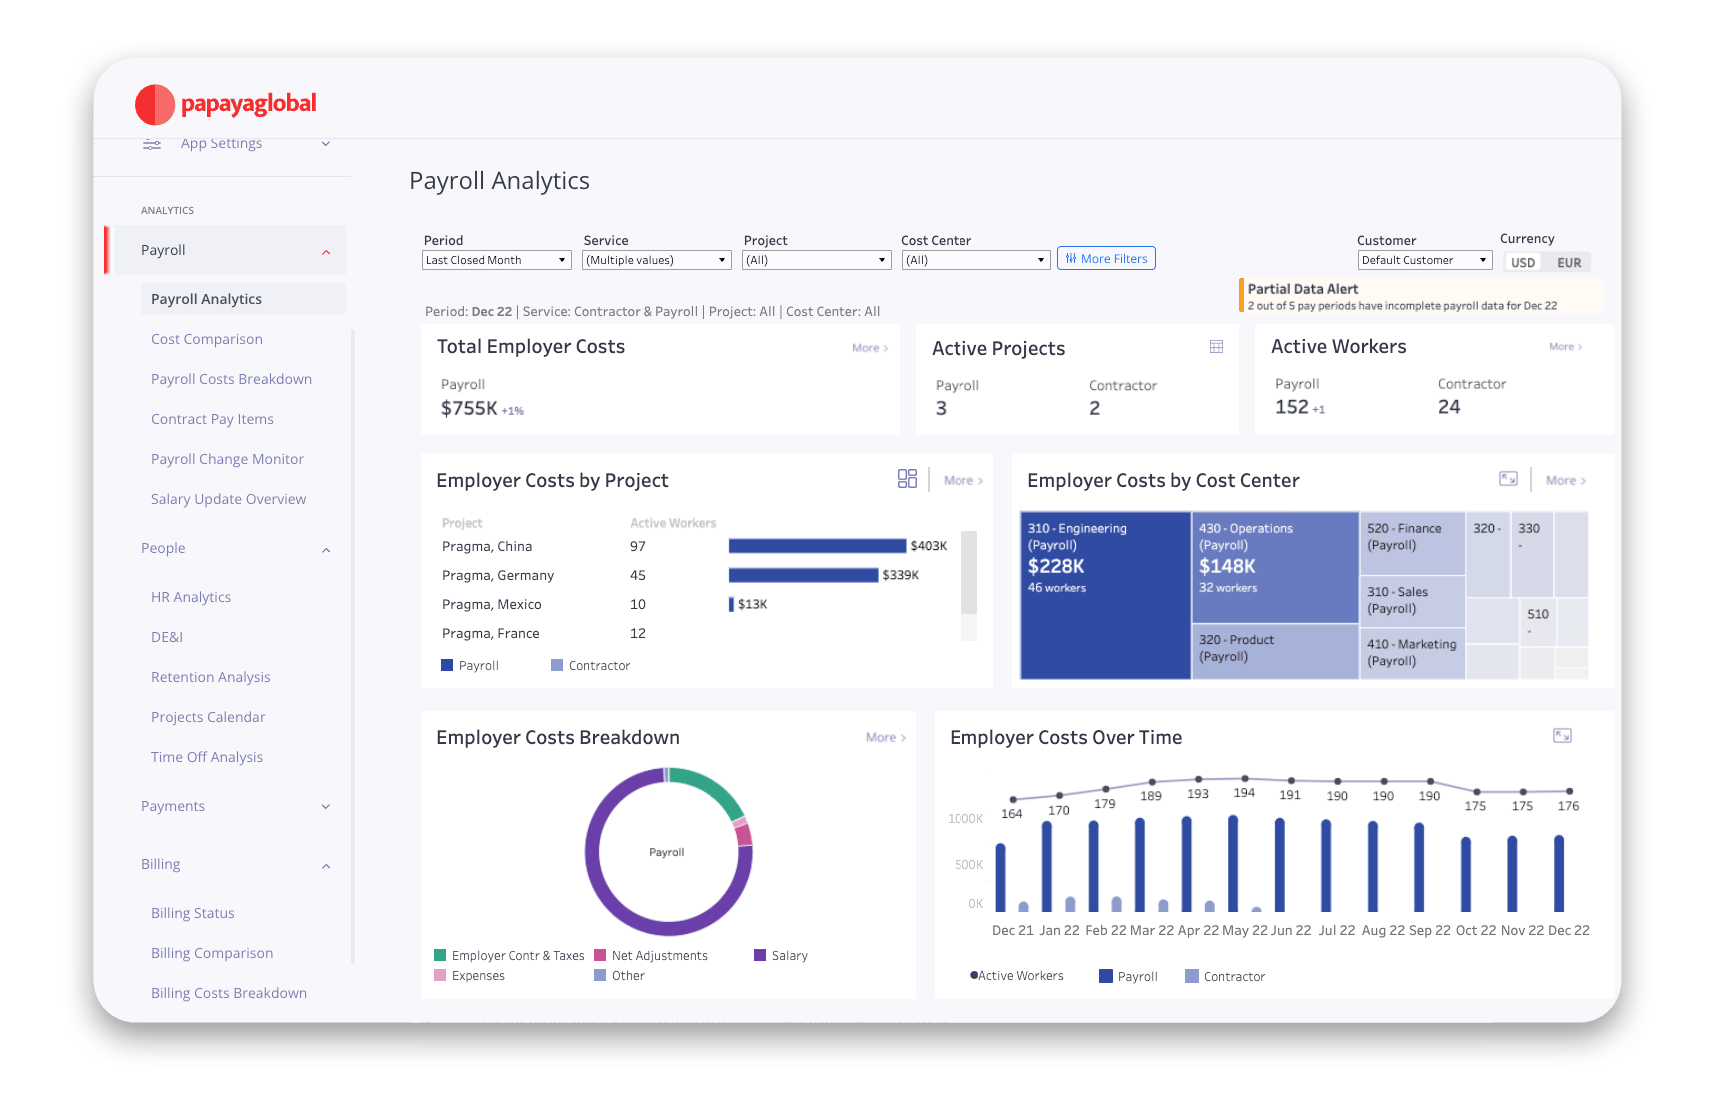
Itzik Polad, Head of BI, Papaya explains, “Our customers want instant insights to important questions, like, ‘What are our total labor costs?’, ‘How do those costs distribute across locations and cost centres?’, how much of this amount is basic versus variable costs?’ , and ‘Did our payroll spend rise this month – and if so why?’.”
Polad and his team launched Tableau more than two years ago to transform the way customers see and understand their people, payroll, and payments data. “Back then, we were a small start-up. It made sense to buy versus build, owing to our limited resources and tight launch timeframe. Tableau was the runaway choice: the flexibility, security standards, user experience, and ongoing upgrades and enhancements as part of its product roadmap are unrivalled,” says Polad.
Consolidated, standardised data means that customers no longer need to switch applications and screens to reach people, payroll, and payments data. By introducing a unified, customised view of the data, they can make faster, data-driven decisions.
Transforming product engagement
With the support of their partner Naya Technologies, Papaya implemented Tableau Embedded Analytics to create a seamless experience across its product portfolio. Customised, interactive, analytical capabilities increase product engagement and improve customer satisfaction by integrating rich content, data, and analytics directly into Papaya.
Polad comments, “Naya Technologies helped us accelerate the roll out and time to value.”
Success followed shortly after. “Over the last three years, we experienced ten-fold user growth,” says Polad. “A lot of that is down to the user experience. A role-based landing page focuses on the top five user types, such as HR, finance, or payroll manager. The person is recognised when they log in and a dashboard presents all the key personalised insights in the first screen they see.”
For example, a finance manager can view the total employment cost, compare it over time, analyze it by country and by cost centre, understand the cost breakdown of the basic pay versus variables, and then the growth over the last year – all at a glance, when the person logs in. Plus they have the flexibility to download customised reports and view the data in CSV or other file types. “We want to answer customers’ main five or six questions in the first dashboard,” says Polad.
These personalised Tableau dashboards are helping to monetise the solution to a global executive customer base – and drive the next phase of hyper growth. “Consolidated, standardised data means that customers no longer need to switch applications and screens to reach people, payroll, and payments data. By introducing a unified, customised view of the data, they can make faster, data-driven decisions,” he says.