
Premium retailer de Bijenkorf unifies business data and unlocks new customer insights with Tableau
Deep insight into buyer behaviour
Promotions synched with sales trends
150+ staff self-serving analytics needs
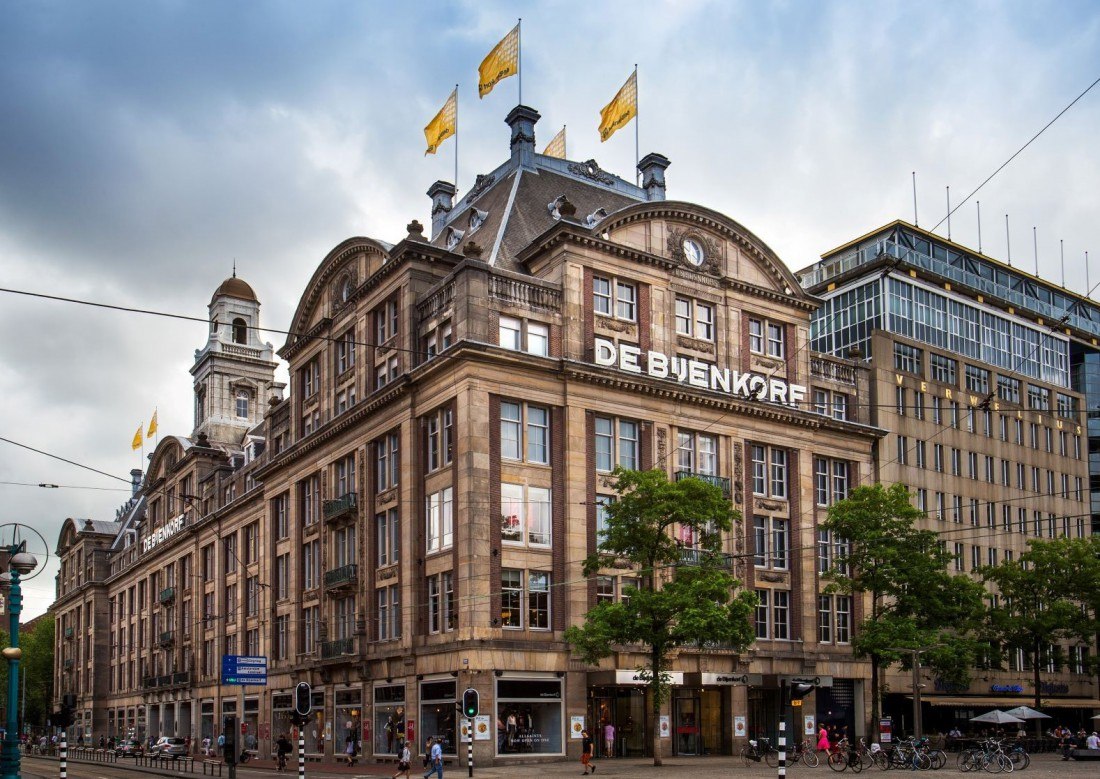
Originally founded in 1870, de Bijenkorf is an exclusive chain of department stores in the Netherlands. Headquartered in Amsterdam, it owns seven stores across the country and operates a highly successful e-commerce business, specializing in premium and luxury goods. De Bijenkorf first began using Tableau in 2014 to unify disparate data generated through its e-commerce business. Now, Tableau has become an integral part of daily operations for 10 departments, ranging from finance and HR to customer care and risk assessment. Adoption of Tableau has also helped foster a collaborative culture of self-service analytics within de Bijenkorf, with over 150 employees using it to achieve their data needs each day.
Tableau allows the sales and marketing team to correlate sales data with things like social media trends for the first time. Doing so helps them understand buyer behavior on a much more intimate level and pinpoint exactly what’s driving sales of particular products.
E-commerce operations optimized by creating single source of truth
De Bijenkorf is one of the most established brands on the Dutch high street and enjoys a long heritage in luxury retail, but much of the company’s recent success has come from its thriving e-commerce business.
“In 2009, it was decided to place greater emphasis on our online operations, which resulted in a significant uplift in sales from that side of the business. As part of our premium experience strategy de Bijenkorf has a focus on omnichannel retailing”. says Maarten Schuit, team lead of data engineering at de Bijenkorf. “There is so much data coming in, managing it quickly was the challenge.
A couple of years ago the company was partly relying on Excel spreadsheets for much of its data management. It happened that multiple versions of the same spreadsheets existed across the business. Different e-commerce teams also had conflicting definitions, how to measure sales or of what a (web) visit was, which resulted in internal arguments and uncertainty. The wish was also to integrate, data from things like Google Analytics and ongoing marketing campaigns into the existing Qlikview platform they were using.
“This meant there was ample room for improvement on how accurately we could see how the online business was doing,” says Maarten. “We knew a better approach to data was needed.”
After consulting with e-commerce specialists, de Bijenkorf decided to consolidate all its online business data into a central data warehouse and implement Tableau for visualization and analytics needs. This approach created a single source of truth for the first time, eliminating duplicate data sets and inconsistencies between different teams.
“Implementing Tableau quickly provided everyone in e-commerce with the fast access to consistent data sets that they needed,” says Maarten. “Every team was working from the same information.”
Establishing a single source of truth also had a significant impact on a number of other business processes, most notably the time spent in internal meeting times.
“Previously, meetings would take longer than necessary because of unclarity between team members over the data sets they were using and who’s was the ‘right’ one,” says Maarten. “Now everyone is working from the same set, which means meetings are a lot shorter!”
Tableau provides fast access to the information our sales and marketing teams need to stay ahead of online trends and ensure we’re offering the best products out there, at the right time.
Deeper insight into buyer behavior leads to more effective promotional activity
With Tableau in place, many insights that previously went unnoticed can now be quickly identified. In particular, the e-commerce sales and marketing team can use Tableau analysis to uncover new information about buyer behavior and the factors affecting purchasing decisions.
“Tableau allows the sales and marketing team to correlate sales data with things like social media trends for the first time,” says Maarten. “Doing so helps them understand buyer behavior on a much more intimate level and pinpoint exactly what’s driving sales of particular products. Off course respecting the GDPR guidelines”
“Online trends move fast and without the right tools in place you’ll always be playing catch up,” says Maarten. “Tableau provides fast access to the information our sales and marketing teams need to stay ahead of these trends and ensure we’re offering the best products out there, at the right time.”
Tableau’s ease of use also lets the team quickly customize different data sources and create new views, based on what will help them get the information they need.
“In just a few clicks, the team can create a completely new visualization if they wish,” says Maarten. “And with the data refresh scheduling, it means they don’t spend mornings updating spreadsheets”
In just a few clicks, the team can create a completely new visualization if they wish. And with the data refresh scheduling, it means they don’t spend mornings updating spreadsheets
From side project to center stage: building a thriving self-service analytics community
What started as a side project in e-commerce has quickly spread across the company. Now, 10 different departments in de Bijenkorf use Tableau for their data visualization and analytics needs including marketing, operations, HR, finance, store operations and risk assessment.
A key factor in this adoption has been the work of Maarten and his team to encourage self-service analytics amongst employees, using the Tableau platform.
“Once people see Tableau in action, they want to know how it can help them with their own analytics needs,” says Maarten. “Rather than just serving them up dashboards and reports centrally, we train them to use Tableau for themselves. With a little bit of help, they can quickly start building their own data sources and creating the dashboards they need to answer their own analytics questions.”
The company now has over 150 regular Tableau users and Maarten expects this number to grow significantly.
A more consistent approach to business analytics and reporting
The ability to create standardized reporting templates in Tableau means the more users there are within de Bijenkorf, the more consistent reporting has become both internally within the company and externally to stakeholders and suppliers.
“As the percentage of reporting done in Tableau goes up and the percentage in Excel and other tools goes down, we’re seeing a marked improvement in the overall quality and consistency of output,” says Maarten. “So more departments are interested in working with this tool”
As the percentage of reporting done in Tableau goes up and the percentage in Excel and other tools goes down, we’re seeing a marked improvement in the overall quality and consistency of output