The role of data
In the US, data and history show that marginalized people—particularly Black, Indigenous, Asian, and LatinX—face deliberately designed barriers to economic opportunities and advancement—from bias in hiring to discriminatory housing policies. Data on disparities can show local advocacy groups and policymakers at all levels of government where interventions are most needed—and show them which strategies are most effective and how they can be scaled to close gaps in prosperity.
Why it matters
Closing economic divides built over centuries of discriminatory policies will not happen overnight—and it will take coordination across agencies and organizations working on policies and programs. Data can expose high-level wealth disparities that national lawmakers could address through policy change. And at the local level, advocacy organizations can use data to push for programs to directly uplift and support communities confronting a long history of disinvestment.
Data in Action
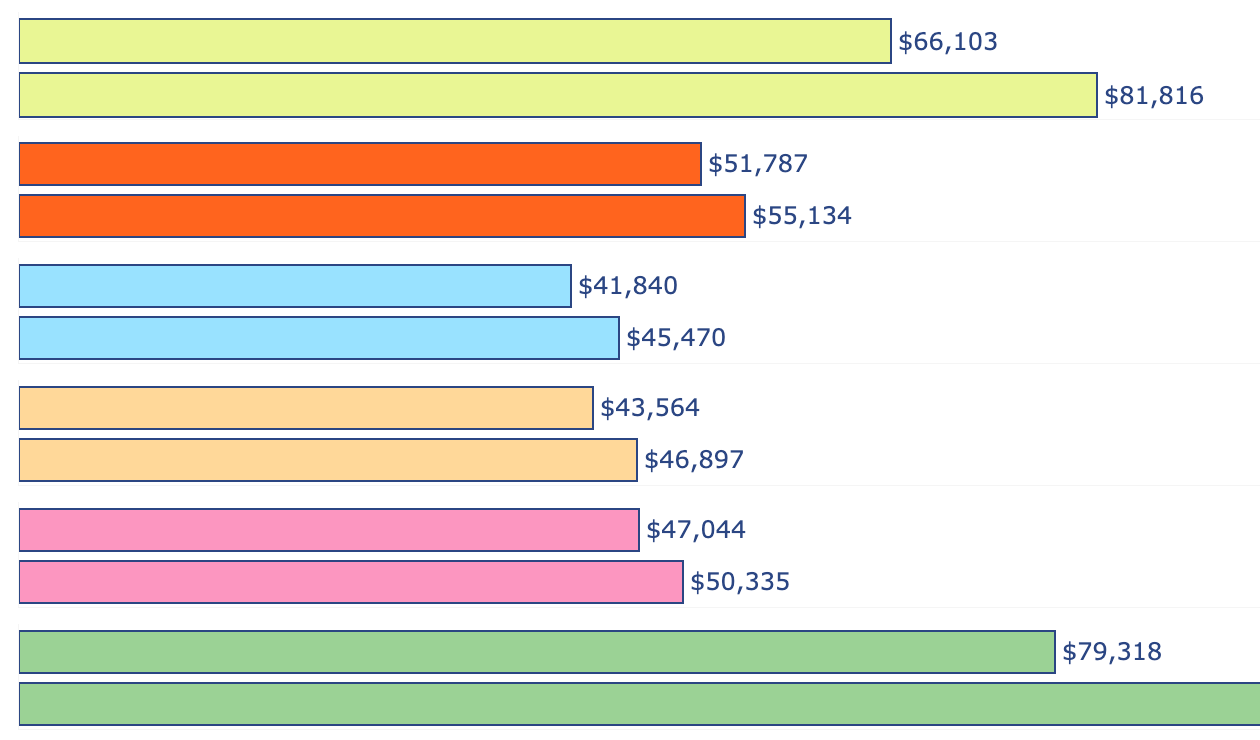
PolicyLink: How is the Black population doing in the Bay Area?
PolicyLink's Bay Area Equity Atlas, developed with the USC Equity Research Institute, provides focused data on racial disparities in the region. Through this dashboard, explore key indicators on the Black population in the Bay—college readiness, police use of force, median income, and the diversity of elected officials—and learn how they relate to overall prosperity and wellbeing.
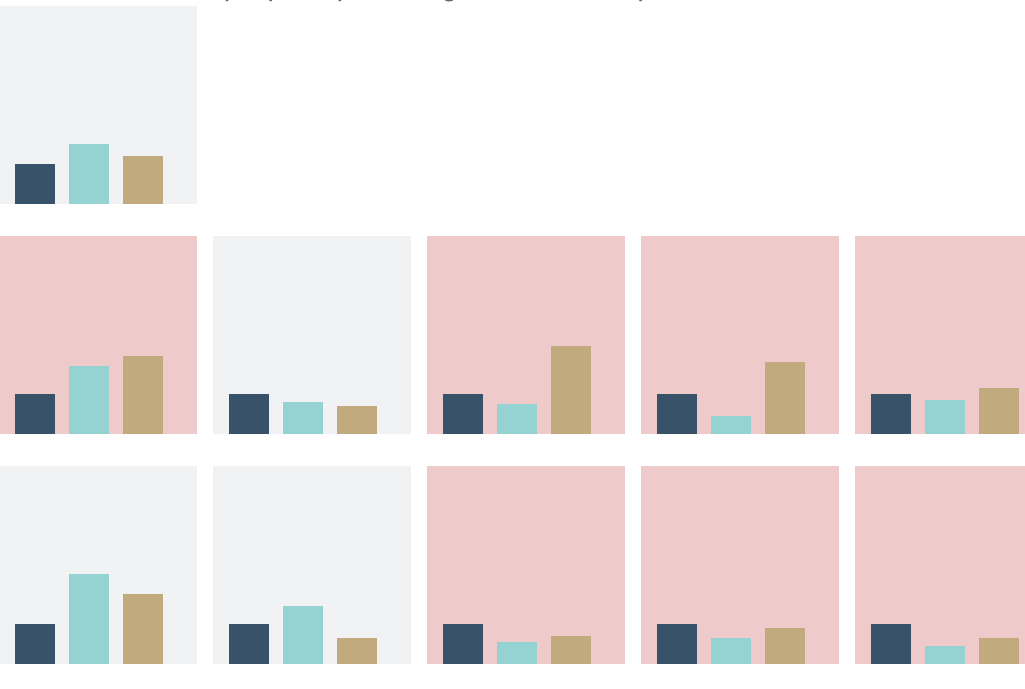
Explore the dataNational Alliance to End Homelessness: Demographics of Homelessness
Using data from both the U.S. Department of Housing & Urban Development and general population counts from the U.S. Census Bureau’s American Consumer Survey, this dashboard displays a tiled map showing rates of racial disparities within homelessness for each demographic group across the 50 states in the U.S.
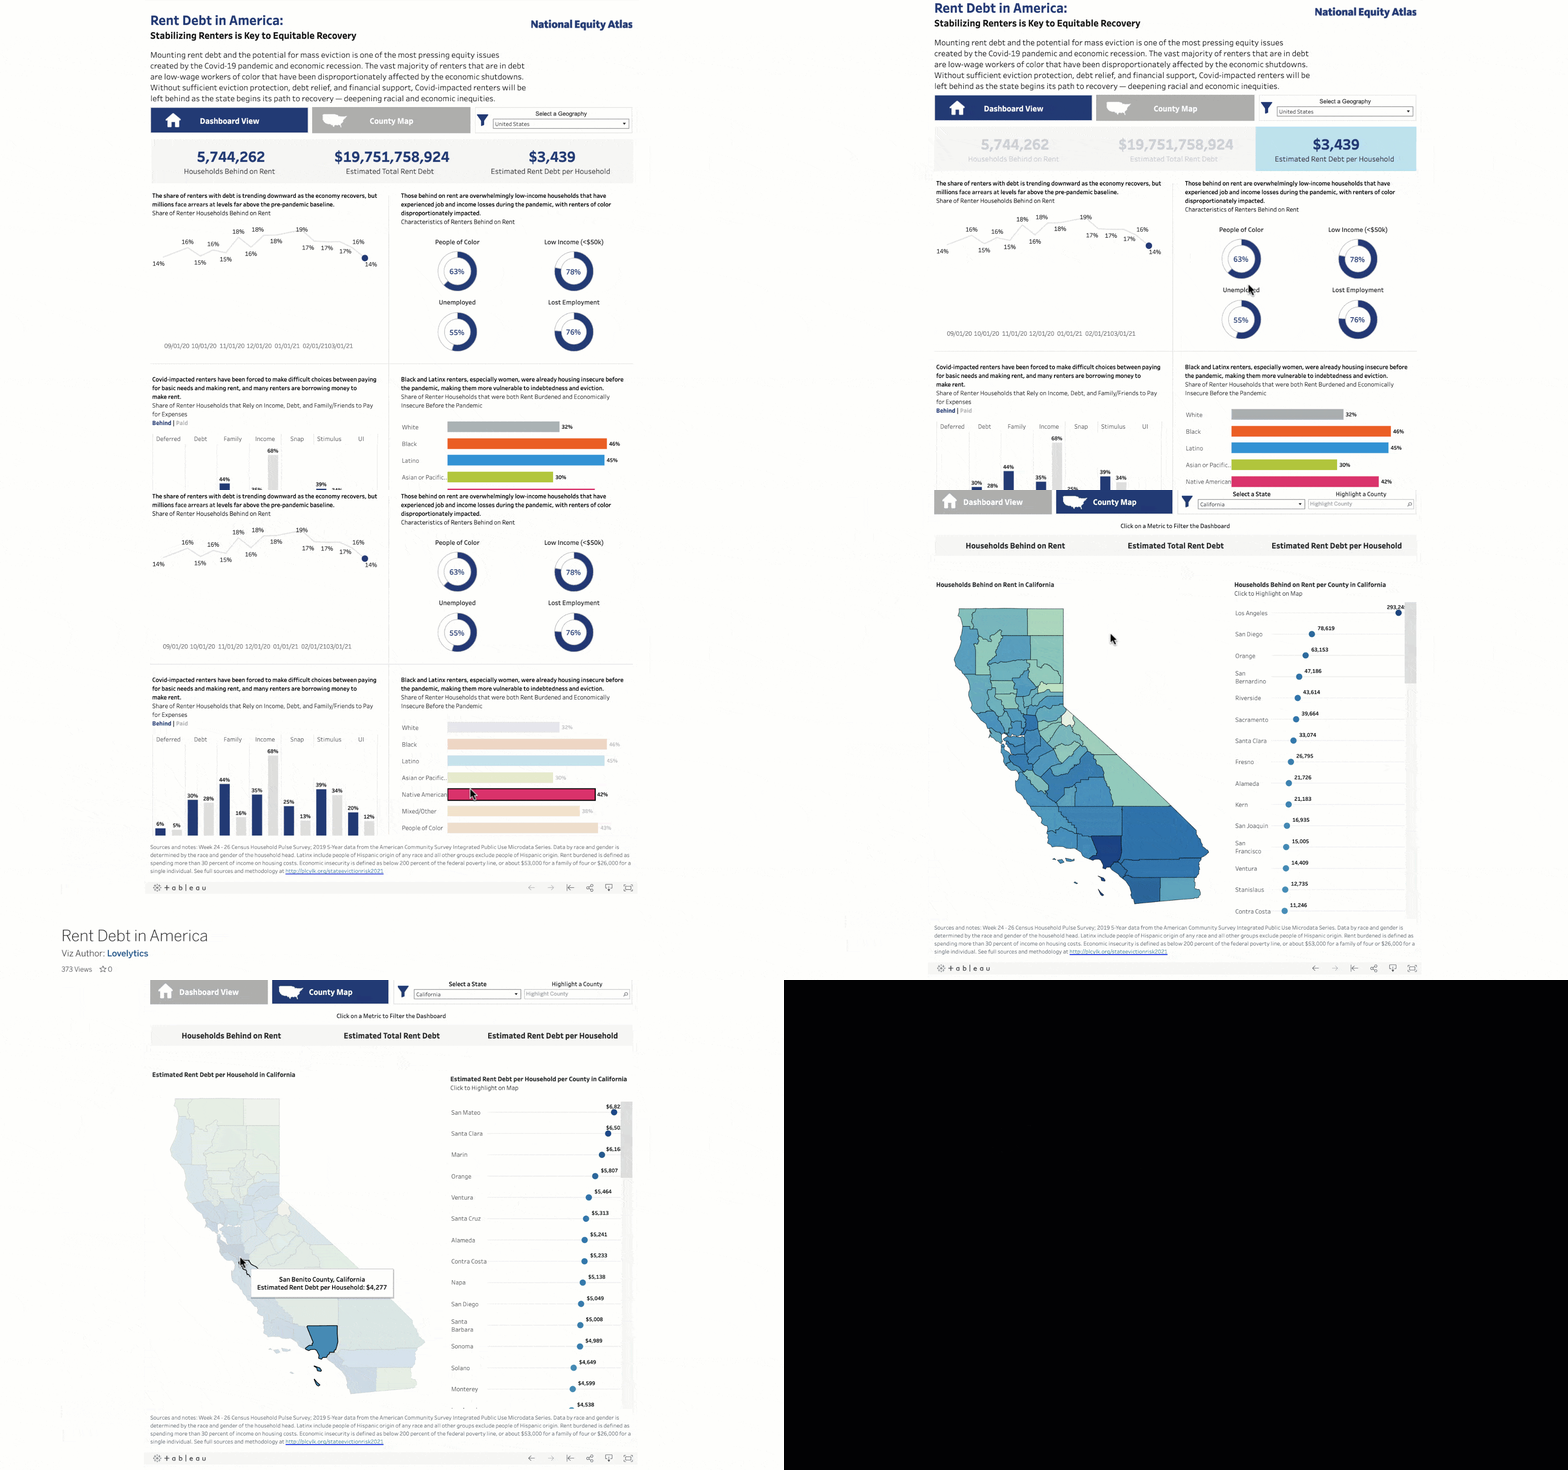
Explore the dataPolicyLink: Rent Debt in America
Without sufficient eviction protection, debt relief, and financial support, COVID-impacted renters will be left behind as the states begin their path to recovery. Data on PolicyLink’s National Equity Atlas shows that the majority of renters in debt are low-wage workers of color that have been disproportionately affected by the economic shutdowns; only deepening racial and economic inequities.
Explore the DataMore datasets to explore on economic power
Our advisors recommend the below datasets to explore disparities in access to housing, benefits, fair wages, and more. Coming soon: These datasets will be shaped and ready for analysis in Tableau.
Have datasets you would like added to this list, or prioritized for workability in Tableau? Visit the dedicated Tableau Community Forum to suggest.
These datasets from the U.S. Census contain metrics that show racial disparities over time, looking at 20 million children and their families. This is a useful resource for analyzing racial disparities over time and across generations.
This dataset on low-income tax return filers and the EITC—a popular poverty-relief program—is filterable by geography and population demographics to provide a clear picture of economic disenfranchisement in the U.S.
This dataset was created to support a 2015 HUD requirement that communities “affirmatively further fair housing.” While that rule is no longer enforced, the data on issues related to segregation, concentrated poverty, and disparities in housing needs and access are still valuable for understanding challenges and potential solutions.
Evictions are a clear indicator of the burden of housing costs, which affect people’s lives in so many ways. This dataset—the first comprehensive record of eviction rates in the U.S.—shows where evictions are most prevalent and who is most affected.
Whether individuals are able to take family or medical leave often tracks with overall economic status. This dataset breaks down access to FMLA by race and ethnicity for further understanding.
These public datasets can be used to analyze social mobility and a variety of other outcomes from life expectancy to patent rates by neighborhood, college, parental income level, and racial background.
This data from the BLS shows average unemployment rates by county for every year beginning in 1990. However, this data is not stratified by race, industry, education level, or any other category, so it would need to be combined with other data for deeper insights.
The current population survey from the BLS measures earnings, labor force participation, unemployment, and other economic indicators using a nationally representative survey. Using these data series, direct gaps in economic outcomes by race can be measured over time for the US on average.
Learn more about race, economic empowerment, and data in the U.S.

Data highlights disparities driving rent debt crisis
PolicyLink's data showing the extent of rent debt due to COVID-19 can point the way toward an equitable recovery.
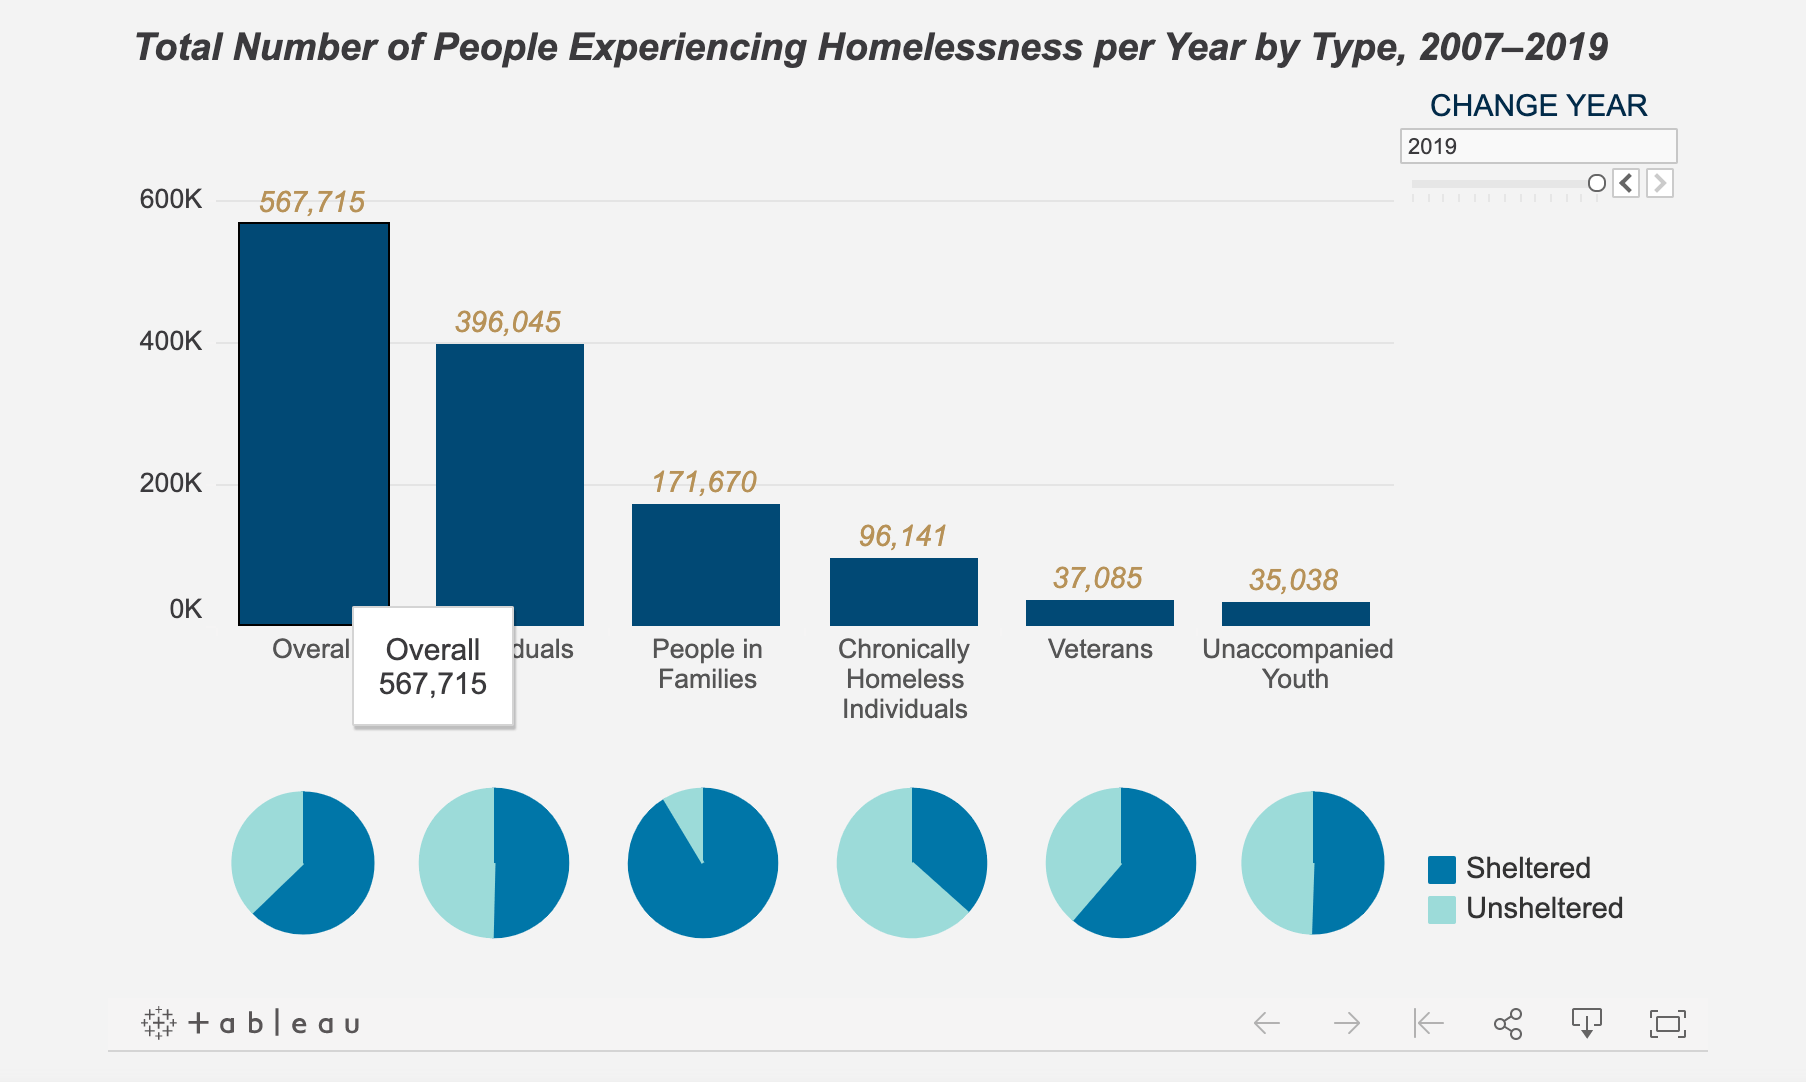
The State of Homelessness: 2020 Edition
Partner organization the National Alliance to End Homelessness visualizes data on homelessness, showing how people of color in the U.S. are most affected.
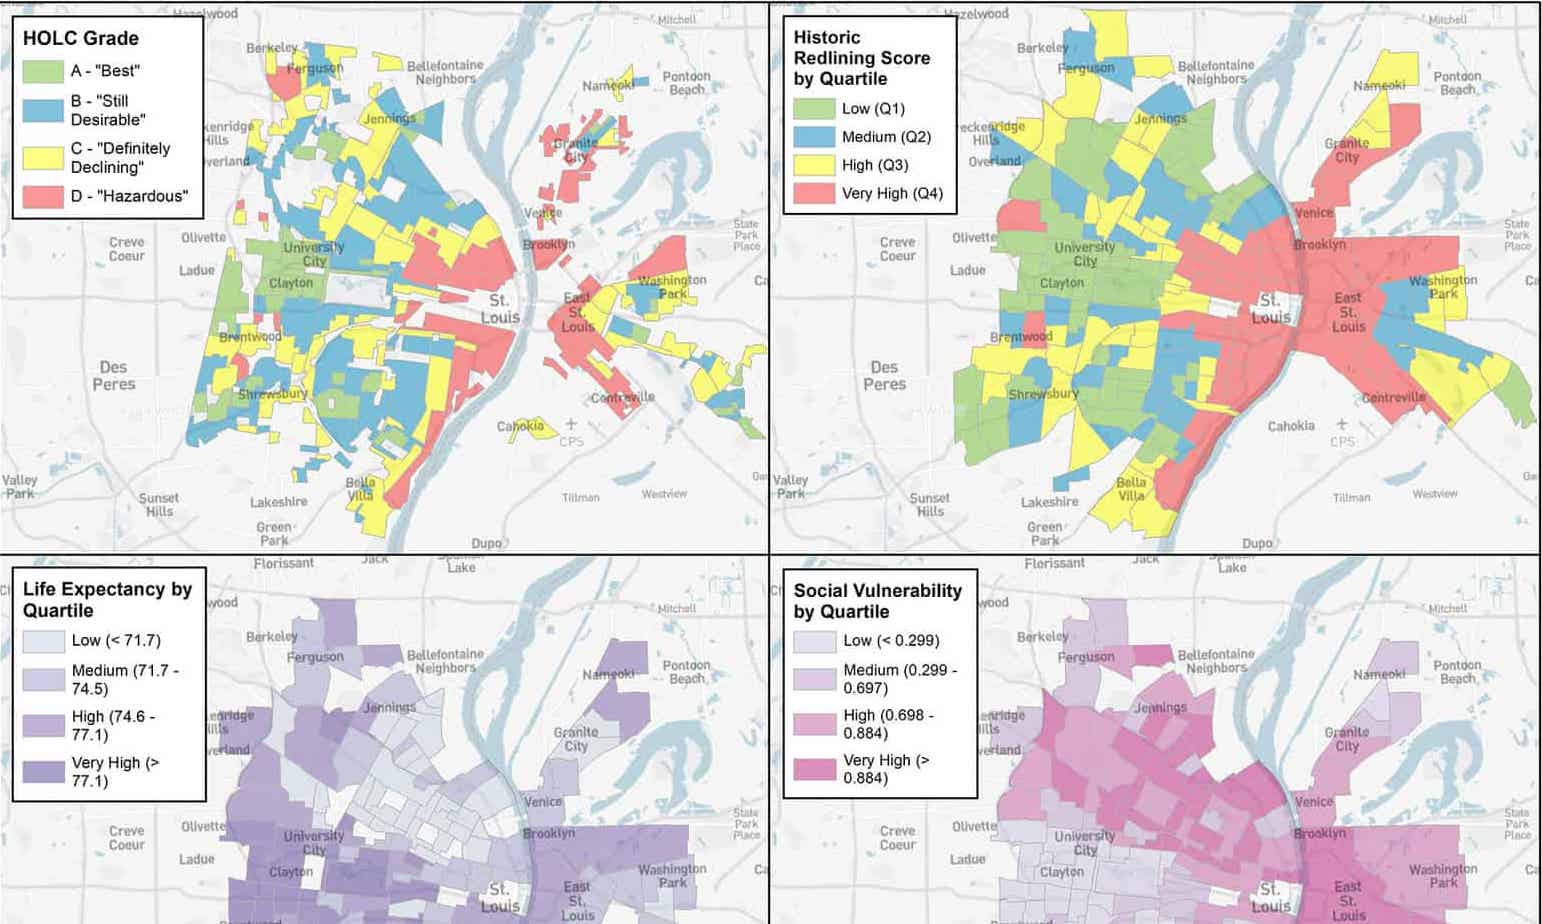
Redlining and neighborhood health
Partner organization National Community Reinvestment Coalition connects historic disinvestment in communities of color to current crises.
Questions? Feedback?
The Racial Equity Data Hub, hosted by Tableau Foundation, is a work in progress. Your feedback is welcome as the Hub continues to evolve. Visit the dedicated Tableau Community Forum to offer feedback, ask questions, and meet others interested in working with data for racial equity and justice.
