How to Host a Data Visualization Exhibition


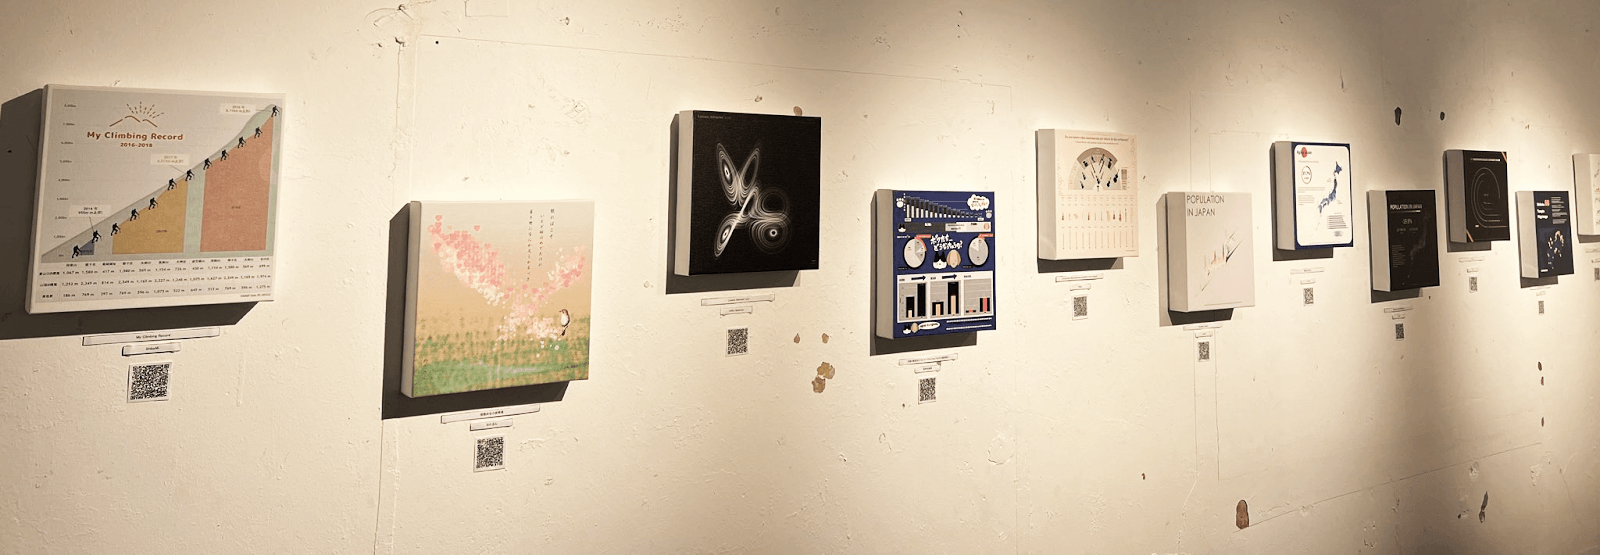

Attendees of the exhibition admiring some of the visualizations.

Dai Iwasaki, Toshiya Kijima and Mika Fukuda, exhibition organisers in front of the cafe exhibition.
This year at the height of Cherry Blossom season, the Tableau Community hosted the first ever in-person visualization exhibition called "Life Colored with Data" in Japan. Members of the Japan Tableau User Group visualized data related to their daily lives in Tableau—which was then printed and displayed in a café in the heart of Tokyo.
“Our Japan Tableau Community had been in lockdown and we’ve been feeling fatigued from only being able to meet virtually. The DataFam was excited for the opportunity to connect in person again,” Tableau Community Leader Mika Fukuda shared. Inspired by the Tableau Conference 2019 Viz Gallery, Mika along with Tableau Account Executive Dai Iwasaki set out to create a community experience to spark data conversations.

Yutaka Sato, Senior VP and GM, Japan Tableau comes to support and admire the gallery with Mika Fukuda, Tableau Community Leader.
Believing that everyone should be able to see and understand their data, the goal was to inspire existing users to try new Tableau features and designs and encourage data newbies to think about data in a new light. “Art is an expression of society, economies and culture— data visualizations are no different. Presenting these vizzes in an art exhibition made it more accessible to the wider public.” With over 50+ attendees viewing the gallery and 10 authors/artists it was a grand success.
Hosting an in-person Viz Gallery has the power to unite people around data. Here are the top learnings when hosting a visualization exhibition to spark data conversations and build community.
1) Source and elevate a variety of visualizations
Showcasing a variety of Tableau visualizations is a great way to elevate people’s skills and teach best practices in Tableau. In this instance, Mika and Dai hosted two virtual sessions to promote the event itself and had Tableau Public authors teach basics in Tableau so creators at all levels could participate.
Mika and Dai clearly outlined the selection process so participants understood what was needed. For the exhibition, the selection criteria included:
- The design must match the context of the data set.
- The ability to understand what is being visualized at a single glance.
For future viz exhibitions, Mika and Dai suggest also sourcing vizzes from Tableau Public. Viz exhibitions do not always need net new viz creations. Visualizations on Tableau Public are curated based on:
- Vizzes by topic or theme—featured on the Tableau Public homepage
2) Consider the medium
When printing vizzes for physical spaces, sizing, colors and fonts is a must to consider. When the selection process is completed, all the viz images need to be downloaded and adjusted to ensure they’re the right size for the printers. Consider visualization elements such as:
- Font: Make sure fonts are legible in a physical space. Consider sizing and readability
- Size: Make sure the visualizations you're printing are adjusted to the poster size
- Color and resolution: Take notice of color tones in RGB and CMYK. Does the resolution need to be adjusted so it’s printed clearly?
For further exploration, include printed QR codes linking to the original visualization on Tableau Public. This is a great way for people to explore the author and their other vizzes.
3) Remember it’s about learning and connection
Choose the location of your exhibition where people can connect and discuss. A viz gallery is an opportunity for vizzers and viewers to come together to appreciate data in a new way. Pick a space where there’s room to walk around, engage in conversation and an opportunity to network after. Mika and Dai chose a cafe which allowed attendees to grab a cup of coffee and leisurely look at vizzes at the same time. This enabled relaxed conversations for attendees to speak with authors and learn how they designed certain vizzes. And for the data newbies, a chance to learn how to get started with Tableau without feeling intimidated.

KT, Tableau Visionary with Nolito Nakamura outside the cafe.
Get inspired by the Tableau Community to bring data to everyone:
- Check out all the vizzes that were show cased at the exhibit here.
- Be inspired by the Tableau Public Virtual Gallery.
- See what the Community is creating and be inspired by all the visualizations on Tableau Public.
- Receive the latest and greatest on program news, member profiles, events and more by signing up for our Community newsletter (DataFam Digest).
Histórias relacionadas
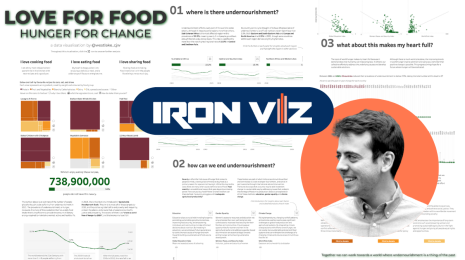
Meet Iron Viz 2024 Finalist Chris Westlake
 22 Abril, 2024
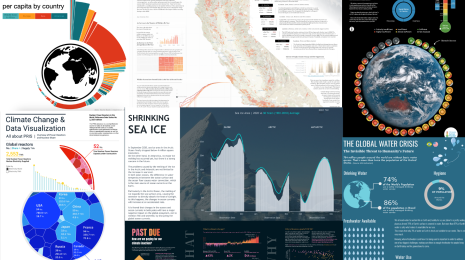
Visualizing Climate Change: Expert Tips from #TheSDGVizProject Leaders
 22 Abril, 2024

Meet Iron Viz 2024 Finalist Jessica Moon
15 Abril, 2024
Subscribe to our blog
Receba em sua caixa de entrada as atualizações mais recentes do Tableau.