A Guide to Mapping and Geographical Analysis in Tableau


Tableau Visionary Marc Reid is a data visualization designer based in London and has been using Tableau since 2017. He shares Tableau tips and tutorials on his blog, YouTube channel, and Linkedin. Tableau Visionaries are the Tableau community's most distinguished leaders who inspire others by sharing their mastery, teaching, and collaborating. Marc originally published this blog "A Guide to Mapping and Geographical Analysis in Tableau" in 2022, and has been updated for Tableau 2024.3.
I read an enchanting book titled “Where the Animals Go”, by James Cheshire and Oliver Uberti. Through beautifully crafted maps, it explores the journeys and challenges of a variety of animals across different habitats around the world.
In the closing chapter, James talks about the parallels between his earlier research in studying human movements and what biologists were trying to learn from studying animals:
“What unites us is the appreciation that in order to fully understand why something happens we often need to know where it happens. Location is everything. And the way we study this is the same whether it relates to an ant, a diving whale or a person with a smartphone.”
With Tableau’s mapping features you too can explore geographical data and begin to answer those ‘where’ questions.
Mapping key concepts
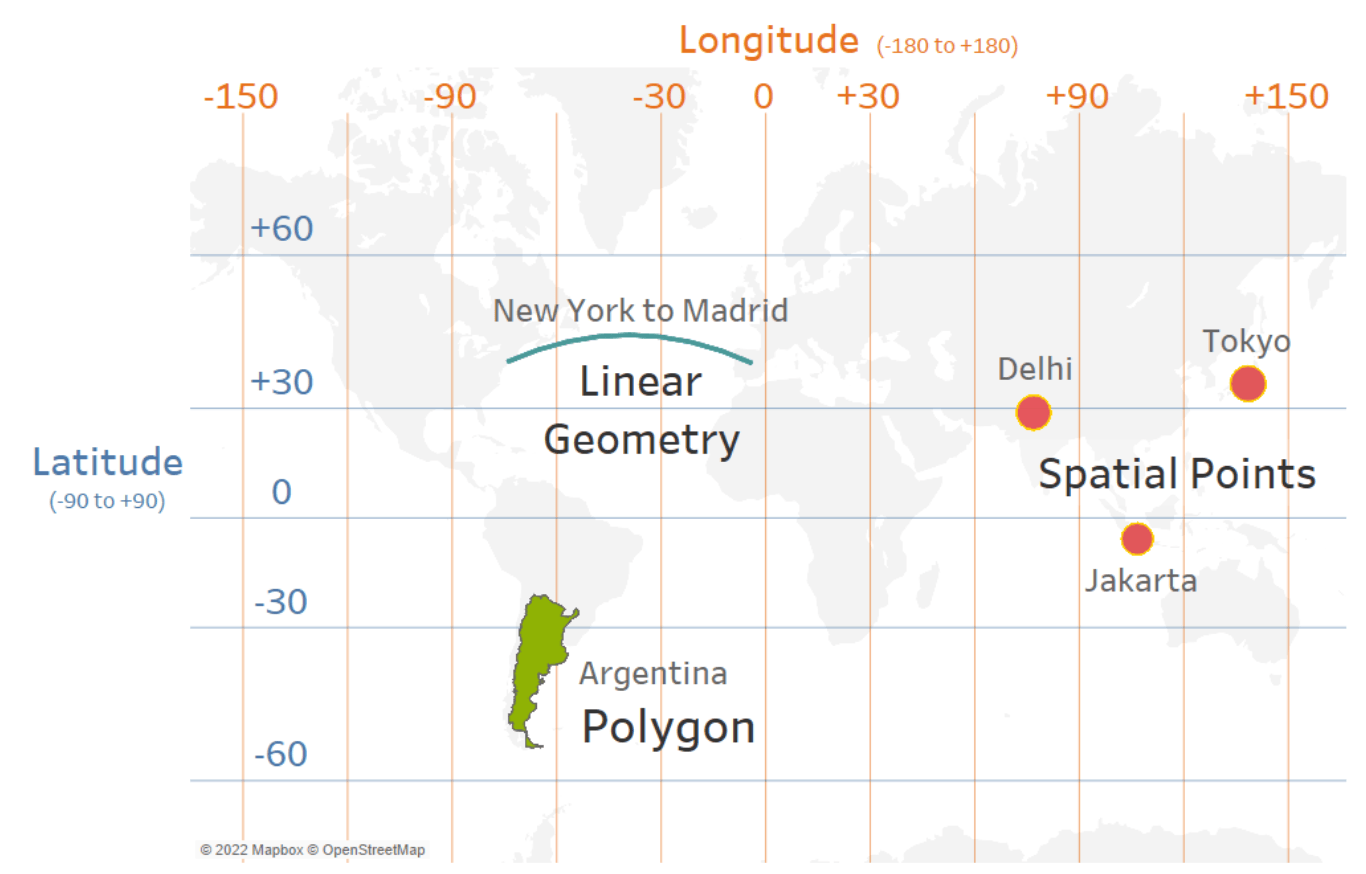
Tableau can map three types of spatial data: points, lines and polygons. To know where these spatial objects should be drawn on the map, Tableau uses coordinates (either latitude and longitude or projected coordinates) and translates them to the right location on the web Mercator projection, which is the map projection used in Tableau and most tile-based web mapping systems. You can learn more about map projections here.
If your data contains geographic fields, such as country names, cities, zip codes, airport codes or others, Tableau can automatically generate the relevant polygon (if it’s an area such as a country) or latitude and longitude values (for points) if they are contained within Tableau’s built-in geodatabase.
Alternatively, you can connect to spatial files, such as shapefiles, GeoJSON, KML and more, that contain the spatial objects you want to show on your map.
Creating a simple map
To create a map with any of these geographical fields, simply double click on the field in the data pane and Tableau will create a map using generated latitude and longitude fields. You can then encode the geographic points or areas in the view with a measure contained in your data.
In the below example I’ve connected to a shapefile containing polygons of the boroughs of London and joined this to an Excel file containing population density data. I then double-click on the Borough field to create a map of London and then add the Borough Name and the measure to show the differences in population density across the city.
Download the workbook here.
Using map layers to combine spatial data
In version 2020.4, Map Layers were introduced, enabling you to layer multiple sources of spatial data on maps to create more comprehensive geographical views. Below is an example from Thi Ho that shows a map of Singapore with seven layers of spatial data, including population, rail lines, and parks:
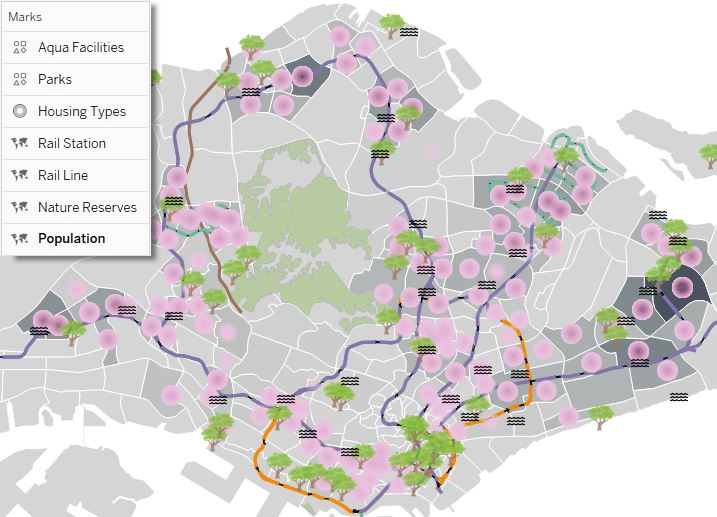
Open an interactive version of the full dashboard on Tableau Public here. Learn more about map layers and how they can be used in this blog post.
In version 2024.3, Tableau introduced spatial parameters, making geographical analysis quicker and easier. Just as traditional parameters allow you to dynamically control values in visualizations, spatial parameters enable the selection of one or more points, lines, or polygons that can then be used in calculations including the new spatial calculations (Symdifference, Intersection and Difference). This feature becomes particularly powerful when combined with parameter actions, allowing you to explore relationships between data sources that don't support joins, create dynamic distance-based queries using buffers, or quickly compare regions. For example, you could use a parameter action to select an area of land from one spatial file, and use that parameter in an Intersection calculation to show all of the buildings in that same area of land sourced from a second spatial file (see example below), all without using spatial joins.
Support for Multiple Data Sources
In version 2021.4 Tableau added the ability to use a different data source for each map layer. This makes creating maps from multiple sources of data much easier as it’s no longer necessary to create relationships or joins between those data sources.
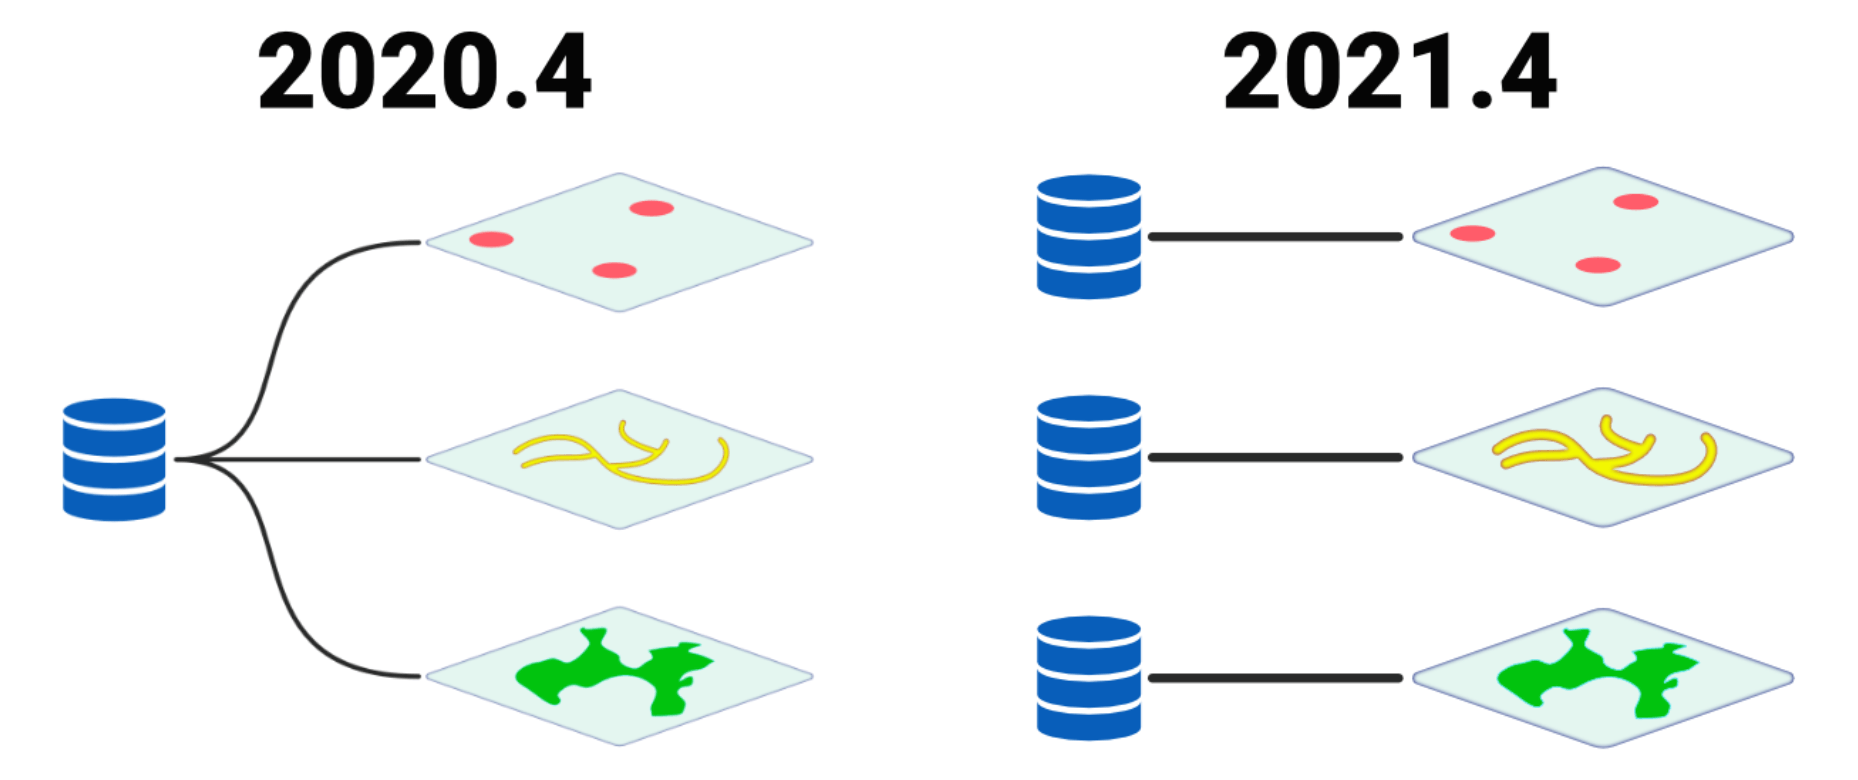
Learn more about using map layers with multiple data sources in this video tutorial, in which three separate shapefiles are used to create multiple map layers:
1. Administrative Areas - polygons shapefile
2. Roads and streets - lines shapefile
3. Educational facilities - points shapefile
Integrating spatial functions
In the last two years Tableau has introduced some of powerful new spatial functions:
- MakePoint - creates a spatial point from latitude and longitude values or projected coordinates if you know the SRID
- Buffer - creates a spatial buffer (a circular object) with a user-specified radius around a spatial point
- MakeLine - creates a line mark connecting two spatial points. The line created is a great elliptical arc meaning it takes into account the curvature of the earth.
- Distance - returns the distance along the great elliptic arc between two spatial points
- Area - (new in 2021.2) returns the total surface area of a spatial polygon
- Spatial intersection joins - enabling joining of files based on spatial fields
These can be combined, enabling you to explore your spatial data in creative ways. The example below allows the user to explore Airbnb locations within range of a target location, select an Airbnb, and then see the number of car charging points within range of the selected Airbnb:
The above dashboard makes use of multiple data sources along with Buffer, MakeLine and MakePoint spatial calculations to create the interactive functionality. To learn more about how this dashboard was created see this blog post.
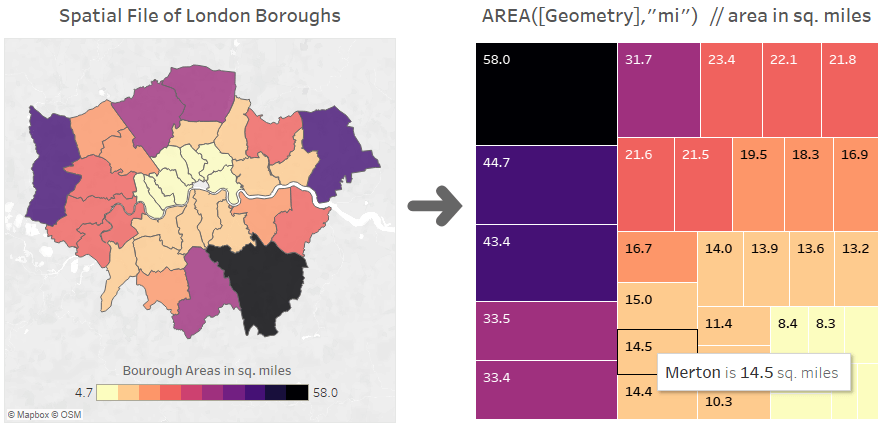
The area calculation
As mentioned earlier, in version 2021.2, Tableau’s latest release at the time of writing, a new spatial function was introduced. The Area calculation returns the square area in either miles, kilometres, meters or feet of a polygon in a spatial file that you have connected to.
In the below example I have connected to a spatial file containing the boroughs of London. To show the area of each borough in my dashboard I would previously have had to join the spatial file to another file that contained that information. Now Tableau can calculate that value directly from the shapefile and we can use it in our analysis and visualizations:
Learn more about the new Area spatial function in this blog post.
Improved spatial joins
Spatial joins originally only supported joins between point and polygon geometries. The combinations of geometry types that can now be used has increased to include: polygon/line, polygon/polygon, and line/line enabling a wider variety of use cases.
For example, with a shapefile containing line geometry of roads and a second shapefile with polygons of states, you could create a join to determine which lines cross state boundaries.
I hope you’ve found this overview of mapping features useful. Please explore the further resources below for more information on analyzing your spatial data with Tableau.
Mapping resources
Mapping is such a feature rich area of the product that it’s impossible to cover everything in one post. Please visit the resources below to learn more:
- Tableau’s mapping help page
- Building different types of map (proportional symbol, distribution, density, choropleth, flow, origin-destination, dual-axis and more): Tableau help page
- Three recorded Tableau webinars including ‘Advanced Mapping Techniques’
- Adding QGIS to your Tableau workflow: blog by Sarah Battersby
- Using alternative map projections in Tableau: blog by Ken Flerlage
- Mapping your Strava app data in Tableau: blog by Andy Cotreave & Andy Kriebel
- Many examples of Tableau maps and mapping advice: blog by Sarah Bartlett
- Integrating custom Mapbox maps into Tableau: blog by Marc Reid
Marc Reid is a data visualization designer based in London and has been using Tableau since 2017. He shares Tableau tips and tutorials on his blog and YouTube channel, and can also be found on X and Linkedin.

Histórias relacionadas

9 Tips to Succeed in a Tableau DataDev Hackathon
 8 Janeiro, 2025

Making Tables Smarter: Key Features of the Tableau Table Viz Extension
 14 Novembro, 2024

How To Get Your Fitness Data Ready For Tableau
 3 Novembro, 2024