DataFam Roundup: November 6–10, 2023


Welcome! Dig into this week's DataFam Roundup—a weekly blog that brings together community content all in one post. As always, we invite you to send us your content—and the DataFam content from your peers that have inspired you! Find the content submission form here.
Community Highlight
To recognize new and consistent Tableau contributors—we’re excited to have a section within the weekly DataFam Roundup called the Tableau Community Highlight. Find out how to get involved.

Darpan Bajaj, Consultant @ Deloitte
Delhi, India
Darpan Bajaj is a Consultant at Deloitte where he uses Tableau to create business dashboards and outside of work to create YouTube content. In 2020, to gain a better understanding of Tableau, Darpan completed courses from Udemy and utilized content on YouTube created by the Tableau Community. Soon after he began, he also completed the Tableau Desktop Specialist certification.
On YouTube, Darpan has an audience of more than 2,000 subscribers keeping up with his Tableau tutorials and helpful tips. He recalls spending a lot of time looking for tutorials and answers when he was early in his Tableau journey so he created his YouTube channel with the intent of establishing a single place where beginners can find the answers to all their questions. Through his YouTube channel, he hopes to be able to share his knowledge and make the learning process easier for others.
Connect with Darpan on Linkedin, X, Tableau Public, and on his YouTube channel.
DataFam content
Dive into content created by the Tableau Community:
- Sean Miller, HipsterVizNinja: How to make an UpSet Plot in Tableau
- Cathy Young, Tech Tips Girl: Weighted Average by Guest Blogger Cathy Young!
-
Laura Madsen, The Data Leadership Collaborative: Data Governance Myths Part 2: This Time It’s Personal
-
Andy Kirk, Visualising Data: Explore Explain S4 E6 Chimdi Nwosu
-
Vignesh Suresh: Lollipop Chart with Labels above the Bar
-
Anastasiya Kuznetsova: Line Charts Best Practices
-
Deepak Holla: Understanding the significance of Colors in a Calculation Editor in Tableau
-
Venkatesh lyer: How to Compare Date Periods in Tableau
Team Tableau
- 7 Ways to Stand Out and Secure Your Next Data Analytics Role
- Transforming Ideas into Features: Tableau's Commitment to Community-Driven Innovation
Upcoming events and community participation
-
Lights, Camera, Action: Tableau and IMDb Launch Data Visualization Campaign for Movie Lovers
-
2024 Iron Viz Qualifiers: Top 10 Results Jan 17, 2024, 9:00 AM (PST) Virtual Event - Find out the top 10 Tableau Public visualizations, including the 3 finalists selected to compete in the 2024 Iron Viz Championship.
-
READY TO SUPERCHARGE YOUR DATA SKILLS? The Information Lab has free, on demand training courses will help you to make sense of your data and take you from zero to data hero. Developed by our industry leading trainers, our expansive courses cover the basics to intermediate levels of Tableau, Alteryx and Tableau Prep! You can take advantage of the whole course or simply choose the modules you need to brush up on your skills. Start your data journey today by simply selecting your training course below.
-
Demystifying the way to learn Data Visualization! Are you looking for a way to learn Data Visualization and feeling lost? We all have been there and I am going to help you understand the fundamentals and look for a way to learn data visualization.
-
Viz Collab: Hello everyone! I’m excited to be opening #VizCollab back up for another round of matches! In the last year I matched around 40 people for some amazing vizzes, including Viz of the Days and a viz that was featured in a local publication. So if you want to find a collaboration partner sign up.
-
Local Community Conferences by the DataFam, for the DataFam: VizIt Berlin
Vizzes
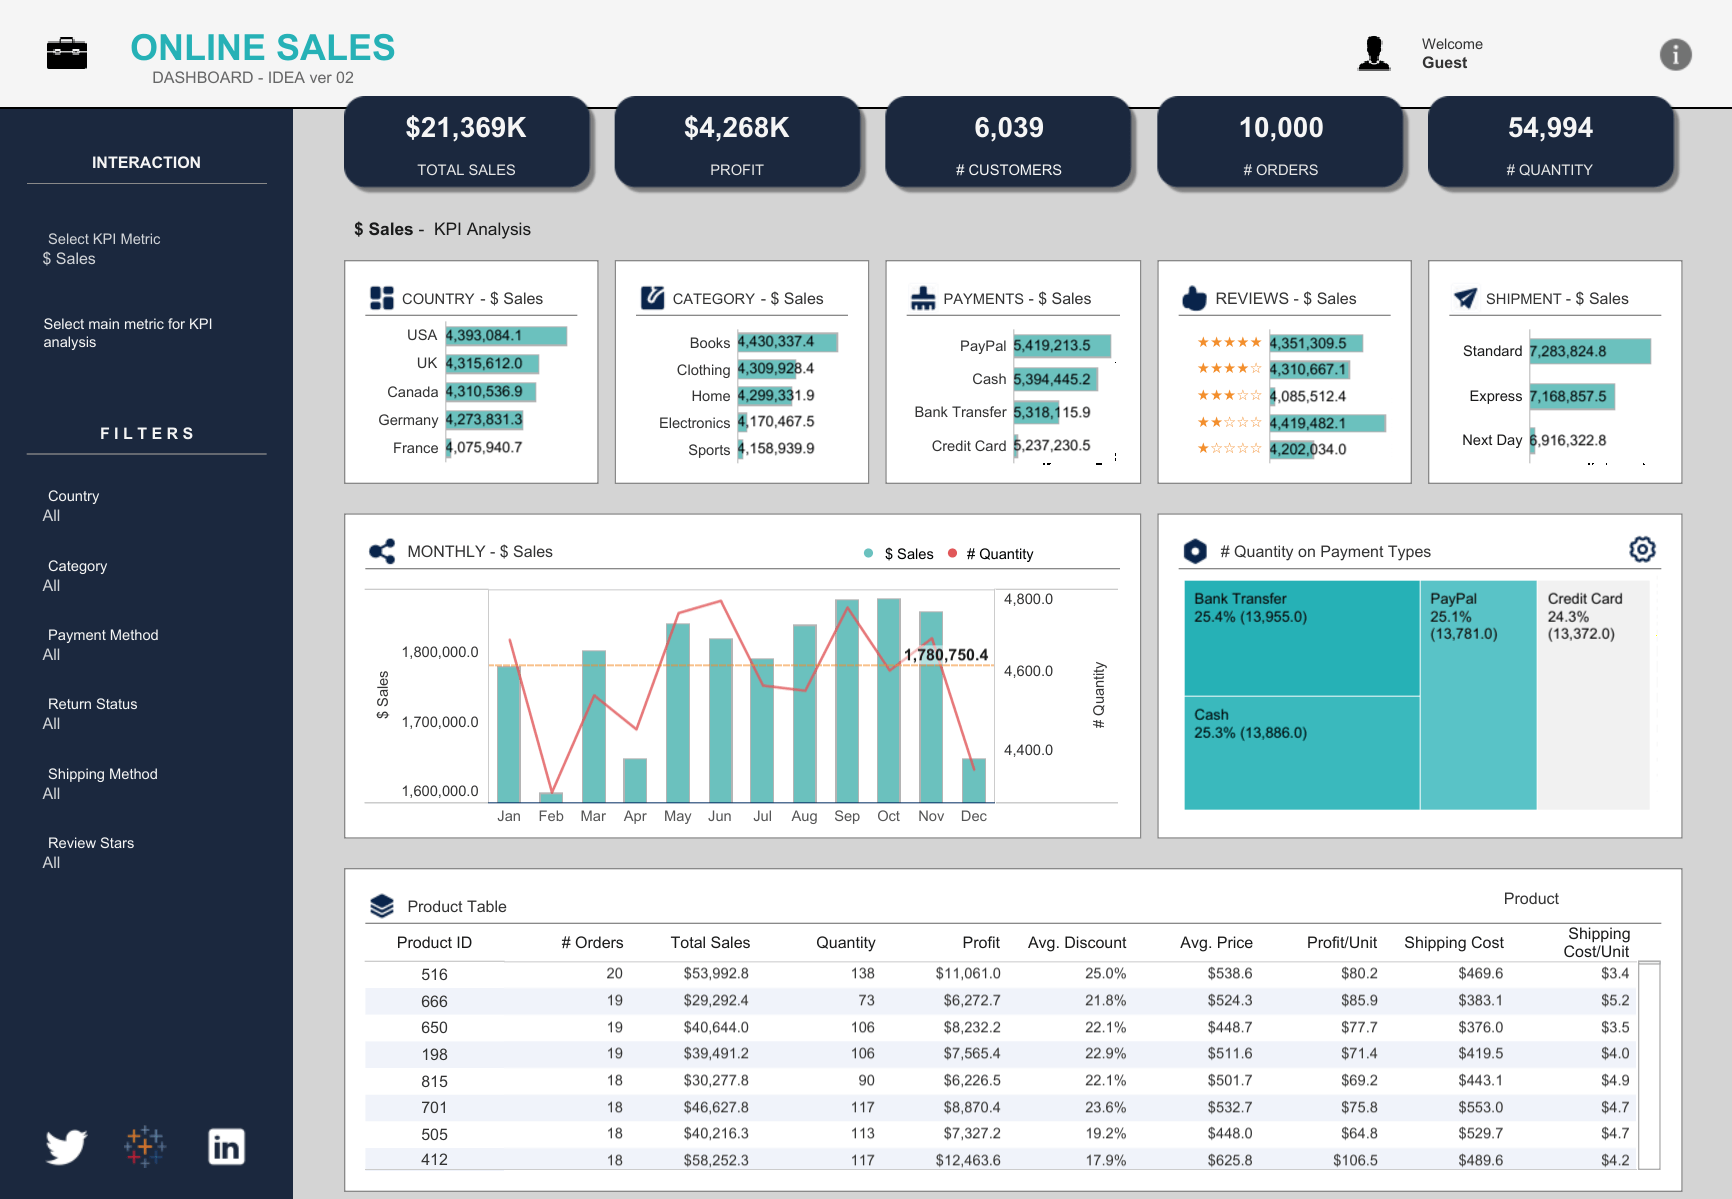
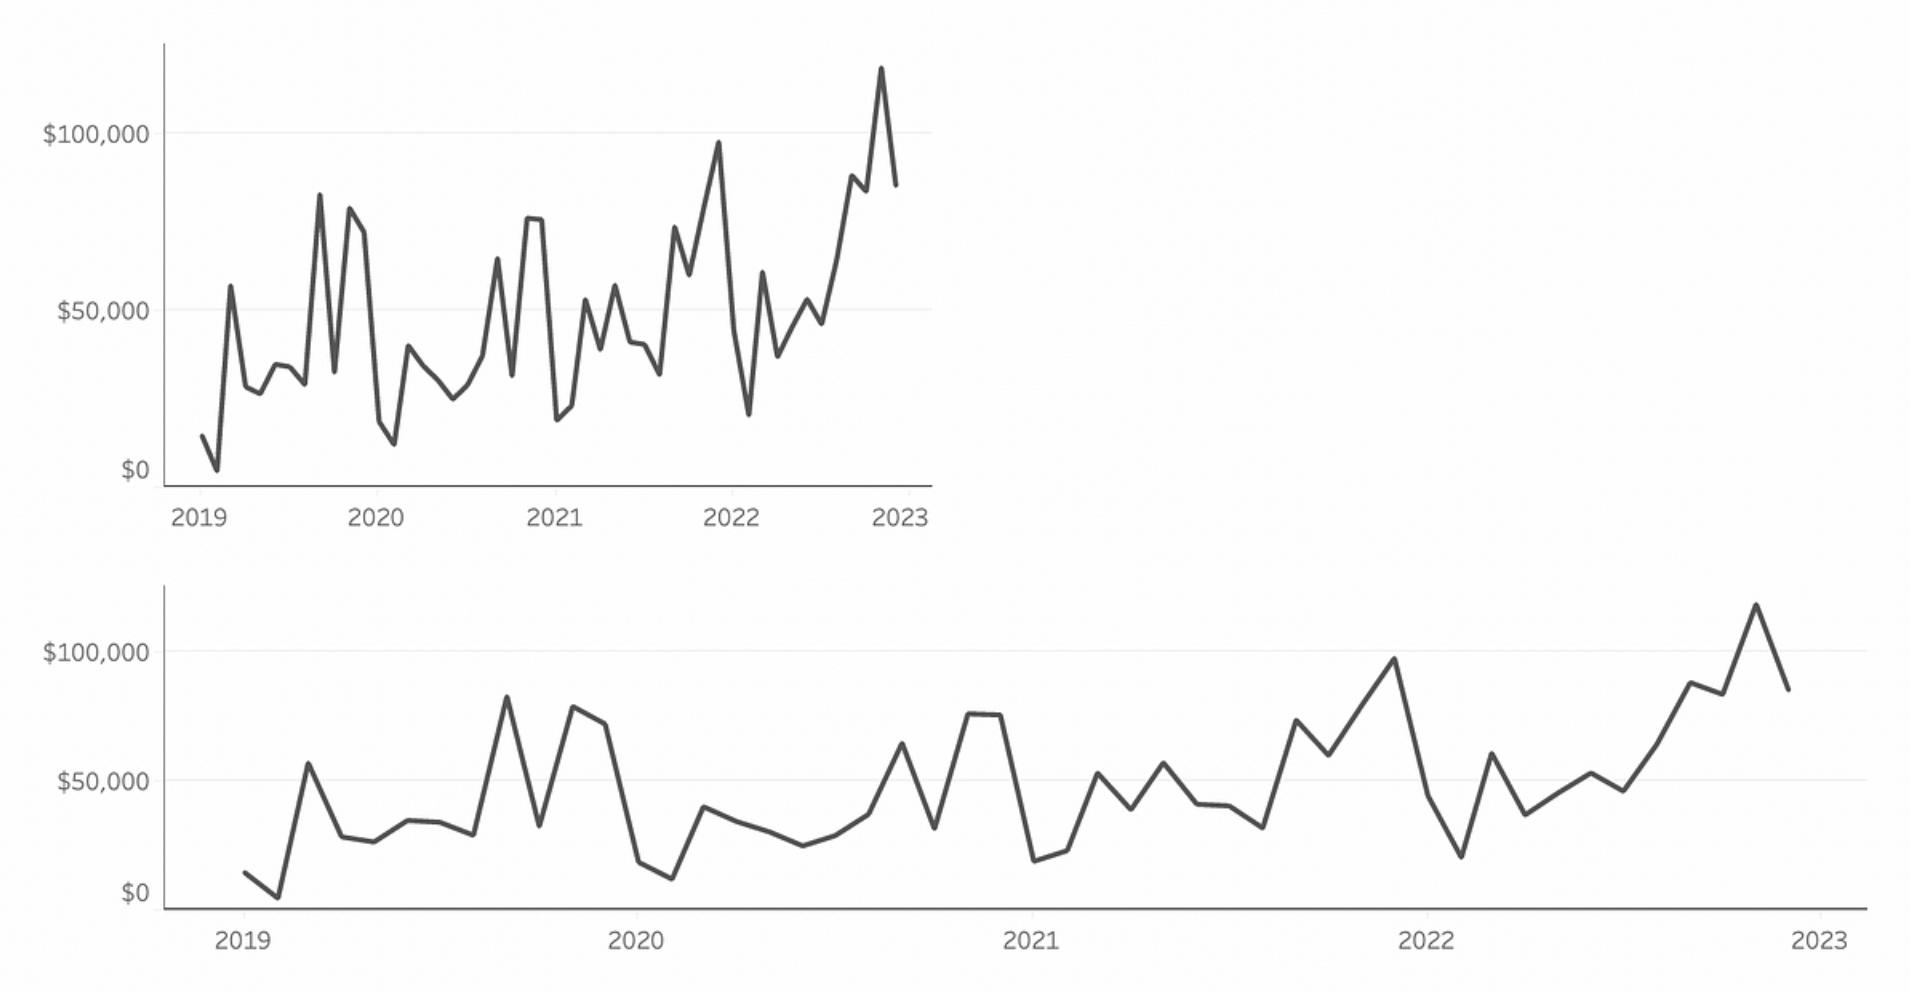
Adrian Zinovei: Sales Dashboard Ver.02
See the latest Viz of the Day, trending vizzes, featured authors, and more on Tableau Public.
Check out some inspirational vizzes created by the community:
-
Rob Taylor: The Bat
-
Sebastine: Periodic Table
-
George Gorczynski: Custom Maps
-
Adrian Zinovei: Sales Dashboard Ver.02
-
Thanoshaan Thayalan: Carlo Ancelotti's Real Madrid Analysis
-
Waqar Ahmed Shaikh: Beyond Borders & Boundries
-
Israel Ayoola: WHERE PEOPLE EXISTS ON EARTH | #VSFG
Community Projects
Back 2 Viz Basics
A bi-weekly project helping those who are newer in the community and just starting out with Tableau. Not limited just to newbies!
Web: Back 2 Viz Basics
Twitter: #B2VB
Week 20: Build a Map II
Workout Wednesday
Build your skills with a weekly challenge to re-create an interactive data visualization.
Web: Workout Wednesday
Twitter: #WOW2022
Week 45: Help me choose my wine
Preppin' Data
A weekly challenge to help you learn to prepare data and use Tableau Prep.
Web: Preppin’ Data
Twitter: #PreppinData
Week 45: Fill Down
DataFam Con
A monthly challenge covering pop culture and fandoms.
Web: DataFam Con
Twitter: #DataFamCon
November 2023: Let’s go on an Adventure! With Tableau’s Data Plus Movies
EduVizzers
A monthly project connecting real education data with real people.
Web: Eduvizzers
November 2023: Scholarship Recipients and Dollars by College Code: Beginning 2009
Games Night Viz
A monthly project focusing on using data from your favorite games.
Web: Games Nights Viz
Twitter: #GamesNightViz
Season 2: Battle of the Strongest
Iron Quest
Practice data sourcing, preparation, and visualization skills in a themed monthly challenge.
Web: Iron Quest
Twitter: #IronQuest
White Space
Storytelling with Data
Practice data visualization and storytelling skills by participating in monthly challenges and exercises.
Web: Storytelling with Data
Twitter: #SWDChallenge
November 2023: create a clever combo chart
Project Health Viz
Uncover new stories by visualizing healthcare data sets provided each month.
Web: Project Health Viz
Twitter: #ProjectHealthViz
June 2023: Funding for Research for Various Conditions and Diseases
Diversity in Data
An initiative centered around diversity, equity & awareness by visualizing provided datasets each month.
Web: Diversity in Data
Twitter: #DiversityinData
May 2023: Mental Health Awareness Month and LGBTQ+ Representation in film
Sports Viz Sunday
Create and share data visualizations using rich, sports-themed data sets in a monthly challenge.
Web: Sports Viz Sunday
Twitter: #SportsVizSunday
Viz for Social Good
Volunteer to design data visualizations that help nonprofits harness the power of data for social change.
Web: Viz for Social Good
Twitter: #VizforSocialGood
Oct 19—Nov 23, 2023: Physicalizing Data for a Better World
Real World Fake Data
Create business dashboards using provided data sets for various industries and departments.
Web: Real World Fake Data
Twitter: #RWFD
Session 5: Diversity Score Card
Makeover Monday
A weekly social data project. Web: Makeover MondayTwitter: #MakeoverMonday
Data Plus Music
A monthly project visualizing the data behind the music we love!
Web: Data Plus Music
Twitter: #DataPlusMusic
Histórias relacionadas

DataFam Roundup June 2026

DataFam Roundup May 2026

Iron Viz 2026: Read Between the Data
 28 Maio, 2026