Todas as histórias de
 Tableau Certification
Mostre ao mundo os seus conhecimentos com uma certificação do Tableau
Você é fera no Tableau? Destaque-se obtendo uma de nossas certificações. Oferecemos dois tipos de certificação para ajudar você a demonstrar suas habilidades. Primeiro, comprove suas habilidades técnicas com o exame Qualified Associate, depois, avalie seus conhecimentos sobre as práticas recomendadas com o exame Certified Professional.
 Product
Do more while publishing workbooks in Tableau 10
You may remember publishing data sources got easier in Tableau 9.3. In Tableau 10, we’ve introduced the same delightful flow to publishing workbooks! Tableau Community
Who do you think should be a 2016-2017 Tableau Zen Master?
 13 Julho, 2016
Do you know someone who is a true Tableau evangelist? Does this person use his or her skills to teach others and bring our mission to help people see and understand their data to as many people as possible? If so, that person just might have what it takes to be a Tableau Zen Master. From today until August 11, we are seeking your nominations for the 2016-2017 Zen Masters.
13 Julho, 2016
Do you know someone who is a true Tableau evangelist? Does this person use his or her skills to teach others and bring our mission to help people see and understand their data to as many people as possible? If so, that person just might have what it takes to be a Tableau Zen Master. From today until August 11, we are seeking your nominations for the 2016-2017 Zen Masters. Partners
Microsoft Azure SQL Data Warehouse: The Tableau experience
 12 Julho, 2016
For those customers running their applications and managing their data in Microsoft Azure, we’d recommend taking a look at Azure SQL Data Warehouse as it’s a massively-parallel processing, high-performance version built for analytics use cases. You can connect Azure SQL Data Warehouse to Tableau through our existing SQL Server connector.
12 Julho, 2016
For those customers running their applications and managing their data in Microsoft Azure, we’d recommend taking a look at Azure SQL Data Warehouse as it’s a massively-parallel processing, high-performance version built for analytics use cases. You can connect Azure SQL Data Warehouse to Tableau through our existing SQL Server connector.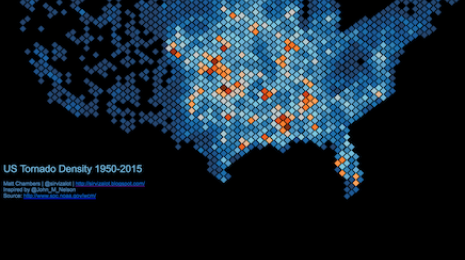 Visualizations
How to create density maps using hexbins in Tableau
Density maps are a great way to show concentration in an area. Let me show you how to create a density map in Tableau. Then we'll take it a step further to use hexbins as part of our density map.
 Enterprise
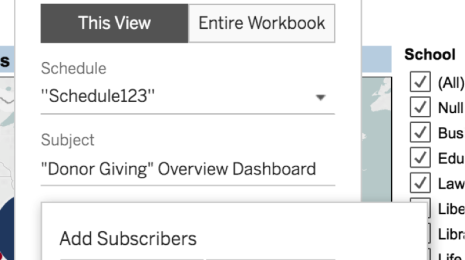
Subscribe others to your views and workbooks in Tableau 10
Tableau 10 lets you subscribe other users to your workbooks and views. You can make sure your entire team sees your weekly KPI reports, or your executives receive your quarterly sales progress in their inbox whenever you want.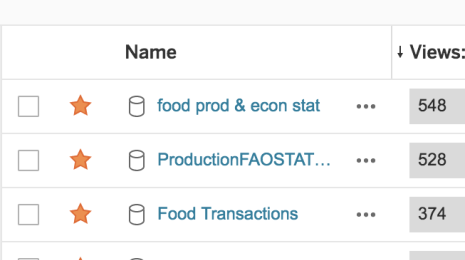 Product
Favorite your data sources in Tableau 10
 8 Julho, 2016
In a world where people can favorite their workbooks and views, data sources have been feeling a bit left out. That’s changing in Tableau 10. You can now mark your favorite data source. And we’ve also made it easier to find the most popular data sources.
8 Julho, 2016
In a world where people can favorite their workbooks and views, data sources have been feeling a bit left out. That’s changing in Tableau 10. You can now mark your favorite data source. And we’ve also made it easier to find the most popular data sources.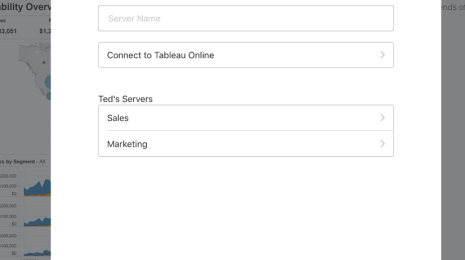 Mobile
Manage your Tableau Mobile deployment with AirWatch or MobileIron
 7 Julho, 2016
Our new Tableau Mobile app is the fastest and most delightful way to stay on top of your data. And we want to make it easy for your entire organization to leverage it. To support your enterprise needs, we’re adding support for VMware Airwatch and MobileIron using a new industry approach called AppConfig. This means you can now securely deploy Tableau Mobile through mobile device-management (MDM) platforms.
7 Julho, 2016
Our new Tableau Mobile app is the fastest and most delightful way to stay on top of your data. And we want to make it easy for your entire organization to leverage it. To support your enterprise needs, we’re adding support for VMware Airwatch and MobileIron using a new industry approach called AppConfig. This means you can now securely deploy Tableau Mobile through mobile device-management (MDM) platforms. Tableau Community
Se eu estivesse começando a usar o Tableau agora: três coisas que ninguém me contou
Comecei a usar o Tableau antes que minha área tivesse um grupo de usuários. Então, se eu estivesse começando a usar o Tableau agora, o que eu gostaria que me dissessem (de novo)?

