Pharma Analytics
Tableau pharmaceutical analytics dashboards give assay quality control an at-a-glance solution, showing your team the z-primes of each plate and each test run, so they can quickly spot assay qualities below excellent.
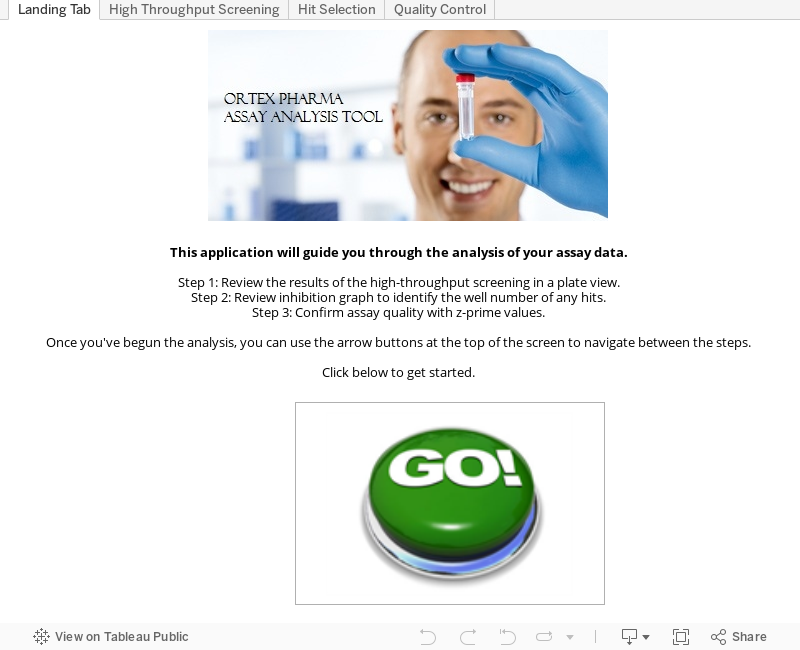
This live app demonstrates how one pharmaceutical team uses Tableau to monitor the results of their HTS drug discovery work. First, the team can view the result distribution and plate view, including key metrics. Next, the app walks the user through the process of mapping well index against percent inhibition and identify hits. Finally, the user is prompted to review z-primes to confirm assay quality.