Better Value through Use of Tableau and AI to Analyze and Visualize RECAIUS Field Voice Intercom Speech/Activity Data for On-site Teams
Intuitive Monitoring of Problems
Short PoC Process Cycle
Background to Implementation
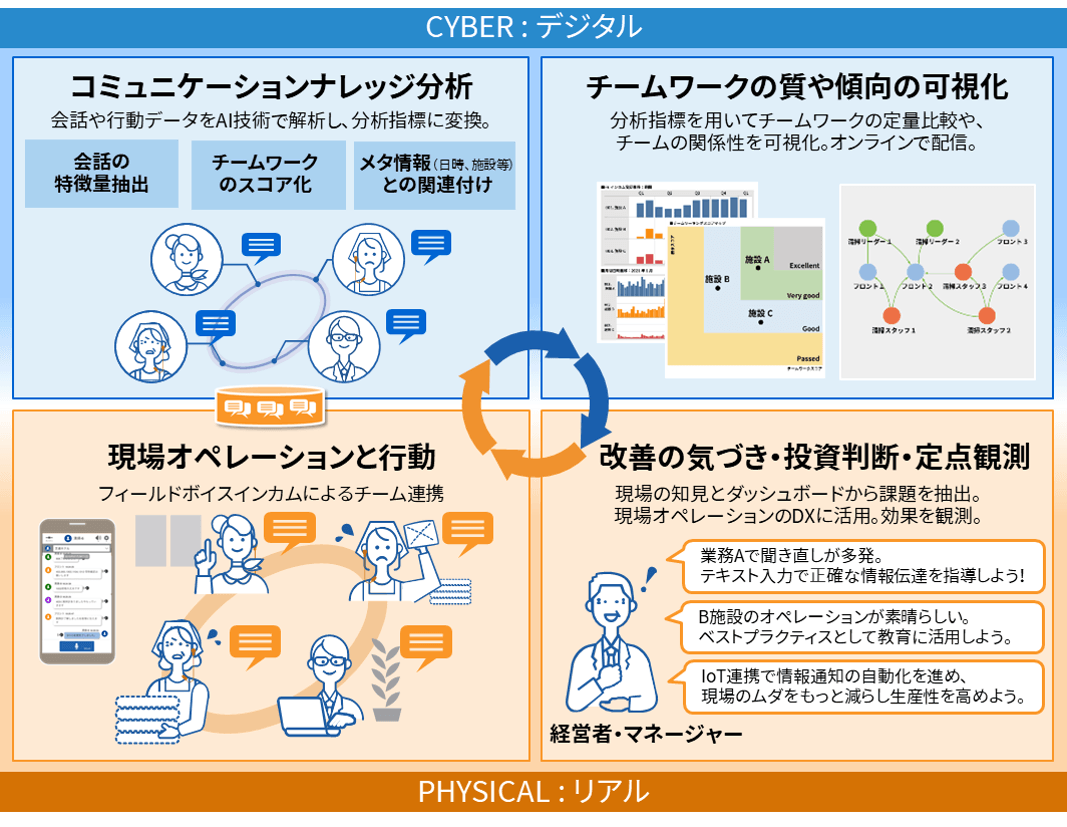
Using RECAIUS Field Voice Intercom to Reform Team Collaborations with AI
Do you want to revolutionize on-site team collaborations with a solution that combines voice and text? The RECAIUS Field Voice Intercom was developed by Toshiba Digital Solutions Corporation (TDSL) to serve your needs. This application enables you to use a smartphone like an intercom transceiver, and it uses AI to instantly transcribe the audio of a conversation as text. It also has text-to-speech functionality and can read text input aloud. This enables communication between staff whose hands are occupied and can only communicate by voice, and staff who are busy with customer service and unable to speak.
“Toshiba has been amassing AI technology for 50 years, and RECAIUS puts that to use in interpersonal communications,” explains Noriaki Koyama, Chief Communication AI Engineer at TDSL. He says this technology is already being utilized in a wide variety of contexts, including for workstyle reforms, creating media content, and at contact centers. “The Field Voice Intercom is one solution for workstyle reform. It is already used at car dealerships, hotel chains, distribution warehouses, and freight companies.”
“Conversation data converted to text by RECAIUS can be stored on the RECAIUS cloud and automatically analyzed using Knowledge AI at the customer’s request,” says Koichi Kagawa, Evangelist in the RECAIUS Engineering Department of ICT Solutions at TDSL. He reflects that once RECAIUS was implemented at a particular hotel chain, the proposal was raised to make this data available for analysis and utilization. “Operational problems can be discovered by statistically analyzing and visualizing data. We thought we could get additional value from voice recognition functionality in this way.”
Analyzed and Visualized Conversation Data with Tableau. We used Knowledge AI to automatically analyze conversation data from workplaces stored in the RECAIUS cloud, and we visualized those results on a Tableau dashboard. We have been providing this solution to one of our clients, a hotel chain, since the summer of 2019.

Tableau Implementation
and Operation Analyzing and Visualizing Conversation Data with Tableau
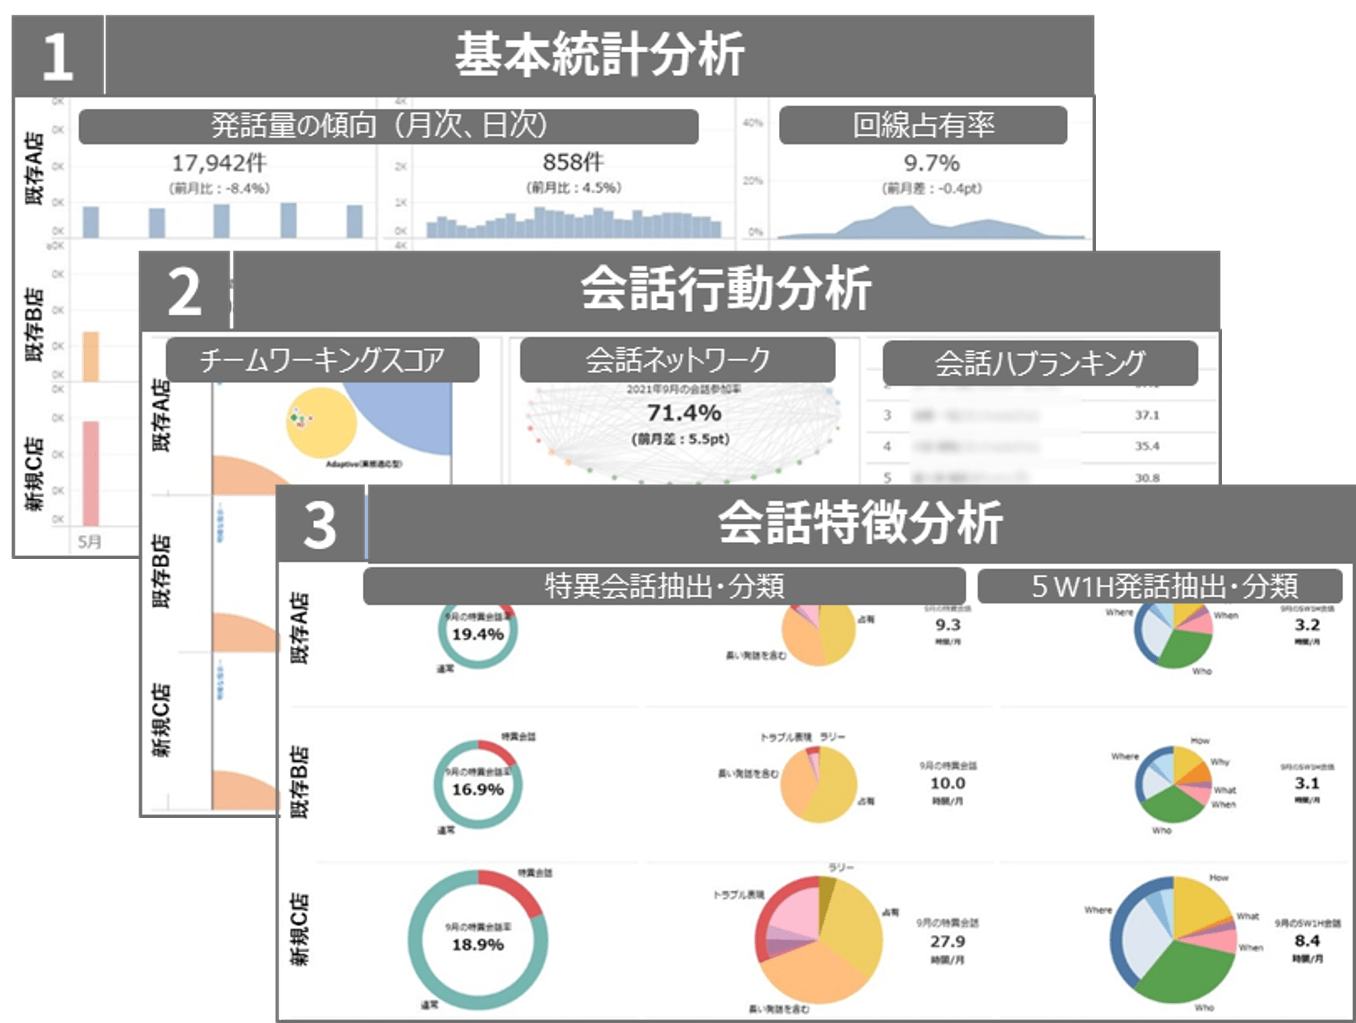
We began selecting BI products to analyze and visualize data. In April 2019, we decided to use Tableau. We used an API to acquire conversation data from workplaces stored in the RECAIUS cloud and fed it to Knowledge AI for automatic analysis. Those results were processed using Tableau Prep, and then further analyzed and visualized using Tableau. Using this system, first we performed “basic statistical analysis” in the form of analyzing and visualizing “the number of conversations and intercom solo usage time.” In the summer of 2019, we provided this solution to one of our clients, a hotel chain.
“Analysis of the number of conversations shows the operational status of the hotel and enables comparison with other hotels to see how they differ. Looking at intercom solo usage time, we can check whether there are ever situations in which someone ‘wants to talk but can’t.’ Analysis like this makes it easier to make decisions such as whether to take special measures for busy time periods or increase the number of intercom lines,” says Kagawa.
Later, we again expanded the range of data that we target for analysis and visualization. Currently, we are able to visualize such things as “activity analysis,” e.g. who is conversing with whom and at what frequency and times; and “conversation characteristics analysis,” e.g. whether conversations are clearly instructions or not, whether the communication style is polite or casual, how many problematic expressions are found in conversations, etc. The frequency of keywords can then be mapped.
Dynamic Data Displays. You can look at data in various ways with a single click. You can create bar graphs with other products, too, but you can’t use them to perform dynamic data analysis like you can with Tableau. Additionally, when we show the data to our customers, it is easier for them to understand it intuitively.

Why Tableau?
Because We Could Instantly Do the Visualization We Want
So why did we choose Tableau? Kagawa and Satoshi Sonoh (Manager in the RECAIUS Engineering Department at ICT Solutions, TDSL) explain the reasoning as follows.
“The most important focus was to avoid wasting time in order to make effective use of BI. Tableau can directly read log data, visualize it, and enable users to analyze it from a variety of directions. Tableau’s basic approach and functionality are excellent, which enables us to instantly turn the things we want to do into reality.”
He also says that Tableau’s ability to visualize time-series data and location data is better than that of other BI products. With other products, he says, it is standard to have to process data even to visualize time-series data. When he thought about combining this data for analysis with natural language data, other products would not be able to handle it, he reflects.
Moreover, it was important that the user interface is easy to understand and anybody can easily make use of it, says Yu Suzuki, who is a Fellow in the RECAIUS Engineering Department at ICT Solutions, TDSL.
“We provide a database of conversation records, and our customers analyze and visualize that in pursuit of new findings. For that reason, it was also necessary for it to be easy for customers to use,” says Suzuki.
Re-confirmed the Importance of Data Visualization. We re-confirmed the importance of not only accumulating data but also visualizing and utilizing it.” By viewing visualized data together with customers, it is easier to convey what is actually happening and to have conversations rooted in reality.

Benefits of Tableau Implementation
The PoC Process and Catalyzing Improvements to Customer Worksites
Choosing Tableau as our data analysis and visualization platform has yielded the following benefits.
User Mastery in an Extremely Short Timespan
First, we dramatically reduced the time required to learn data analysis and visualization skills. “I began studying on my own using the official online videos, and it was only 10 hours until I made my first dashboard,” says Sonoh. Next, he says he continued to gradually pick up the necessary skills while actually making dashboards.
Intuitive Monitoring of Problems
With Tableau, we provide analytical results to our customers in the form of intuitive, easy-to-understand graphs. For this reason, it was possible even for personnel unfamiliar with analysis to immediately understand the key problems and improve operations. When we show graphs to customers on the frontlines, they often immediately ask, “But what about in another situation with different priors?” With Tableau, we can dive into that analysis on the spot and have an immediate lively discussion about how to improve operations.
Short PoC Process Cycle
Since we can create dashboards in a short amount of time, we can also quickly employ trial-and-error regarding “what data should be shown and how to show it.” With Tableau, if an idea emerges for a new way to visualize things, it can be achieved just minutes later, says Suzuki. “After rapidly running through the trial-and-error process several times, a ‘mold’ for data visualization is now taking shape.”
Catalyzing Improvements to Customer Worksites
Since a “mold for data visualization” is taking shape, customers are also having an easier time utilizing data on the front lines and the speed of improvements to frontline operations has increased. “It is clear at a glance who is the hub of the conversation and whether the conversation consists of clear and proper instructions. In some cases, this has helped frontline managers themselves improve the way in which they deliver instructions,” says Kagawa.
Future Developments
Using Data to Improve the Value of RECAIUS Business
We are also considering deploying this “data mold” created with Tableau to other industries other than the hotel industry. Through this, it is expected that we can rapidly visualize conversations in a variety of industries and provide new value to RECAIUS customers.
“One keyword that we want to focus on in the future is ‘insight,’” says Koyama. The key to having customers feel this is a visualization that is intuitively easy to understand, he says. “It is Tableau that makes that the easiest to achieve. We want to actively employ Tableau in the future in order to continue using data to improve the business value of RECAIUS.”
"Analysis of Emotions in Conversations With Field Voice Intercom using RECAIUS, we are already working on recognizing emotions in conversations, and in the near future we hope to use Tableau to analyze these emotions as well. Our customers are also awaiting this technology with immense interest."