Florida International University increases graduation rates by 10% with predictive modeling in DataRobot + Tableau
Captured current and historic data of 60,000+ students to improve academic success, reduce risks
Achieved a 10% increase in four-year graduation rates with data transparency
Saved over 21,000 hours annually with automated, predictive analytics
Florida International University (FIU) is one of the largest universities in Florida and provides a world-class education to local minority and Hispanic students. Many of its almost 60,000 enrolled students have overcome challenging situations; they lived in low-income areas and were sometimes the first generation to attend college or live in the U.S., seeking a college degree to support a brighter future.
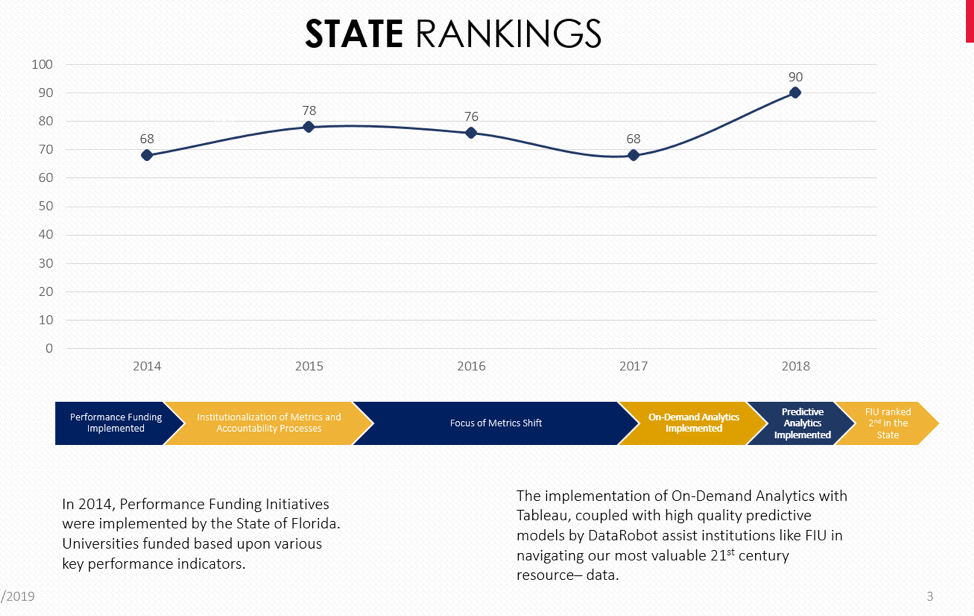
With state performance funding appropriation changes in 2014, funding for operations and academic programs was now based on 10 student and university performance metrics (e.g. post-graduate employment, school access or services) instead of just student enrollment. If overall performance placed them in the top three, they received more funding. FIU needed a deeper understanding of their data to ensure they were hitting these metrics. They also used data to predict what made different groups of students more or less likely to succeed, and made it fully accessible for staff so they could understand what programs or procedures correlated to better performance.
FIU used dozens of predictive data models from DataRobot with nearly 200 Tableau dashboards to convey timely insights about students to 10,000 members of university administration, faculty, and staff. FIU also used Tableau to deeply explore the factors that positively or negatively impacted the academic experience of all students—whether you’re a scholarship grantee or considered mainstream. Now staff understand what drives success for nearly 60,000 students and they modify processes or programs to maximize support and revert trends that put on-time graduation at risk. This resulted in a 10 percent increase of four-year graduation rates overall, nearly 50 percent of students (specifically Pell grantees) graduating in pace with or ahead of other universities, and improved FIU’s ranking by more than 20 points to place them in second with Florida’s performance funding metrics.
Tableau was really a beacon of guidance we provided to people in the trenches, and allowed us to be held accountable for things like student behavior and making sure students are enrolled in classes they need— and helping them achieve milestones during their academic progression.
Data transparency at FIU improves graduation rates for 60,000+ students
To better assist its at-risk students, FIU wanted to shift to a forward-looking view of its data. With constrained staffing resources, they needed a scalable, intuitive solution that staff could use. Tableau made analytics more accessible to departments that can intervene in student’s academics and support success, but pairing DataRobot’s predictive analytics would help FIU uncover and avoid obstacles that put students at risk. "The university and its image are being held responsible for how students interact with the university while they’re here, and how well we can take students coming in and then produce educated graduates four years later,” explained Paden Goldsmith, Assistant Director, Strategic Data Analysis.
FIU analyzed many variables that correlate to student success and reversed potential threats using Tableau and DataRobot. “It was really a beacon of guidance that we provided to people in the trenches and being held accountable for things like student behavior, making sure they’re enrolled in the classes that they need, and achieving milestones during academic progression,” shared Dr. Hiselgis Perez, Associate Vice President, Analysis and Information Management. Variables that influence student performance include course difficulty, proximity to the university (the further away, the higher the percentage of dropouts), and how well they’re transitioned between advisors during college.
With Tableau dashboards deployed across campus, university leadership can see a complete view of academic and student data, but a dean or department chair can filter and access other data shared on the Tableau Server so the Office of Analysis and Information Management doesn’t have to build or maintain separate reports. “The way that Tableau helps us, it’s by far the most effective and user-friendly way to disseminate analysis on a large scale to multiple individuals in a way that they can customize it to meet their own needs,” explained Dr. Perez. Faculty now have actionable, department-specific information in-hand to modify programs and procedures that improve the academic success of at-risk students.
Now, FIU provides a tailored experience from admissions through enrollment to address all students’ educational needs. This improved retention and graduation rates by more than 10 percent since 2018. They’re also applying more intense advising techniques and better curriculum management to improve student employability after graduation.
The way that Tableau helps us is by far the most effective and user-friendly way to disseminate analysis on a large scale to multiple individuals, which allows customization to meet their own needs.
Analytics enhance university performance and state funding rank to second
FIU tried other business intelligence solutions, but the technical knowledge needed to use them, plus fragmented data sources, made it tricky for staff to monitor factors that influence performance with state funding metrics, and correlate with student success. “Even if you learned the tool, there were so many settings and clicks that you had to do to make the simplest thing,” Dr. Perez added.
With DataRobot extensions for Tableau, FIU’s analytics team could rapidly experiment with different scenarios to identify the best strategies for intervention—all without using a single line of code. Tableau Server connects to and integrates hundreds of data sources with millions of records; it’s refreshed and ready in the first half hour of each day. Campus staff access the predictive analytics through an internal portal. “The timeliness of it is the biggest advantage that we have, and the fact that it’s not a black box. We know what the variables are going into it. And we know which variables are more predictive, whereas with proprietary solutions, you don’t understand what puts a person at high risk and how to fix it,” said Dr. Perez.
Now staff from the advancement to research departments continue business as usual, but share and access information entirely or as part of a specially created extract to suit their needs. Instead of not being able to forecast the impact of initiatives on metrics, FIU now uses analytics to model scenarios and see what will have the best impact. Tableau has bridged data science and business analytics to positively influence the school’s performance with state funding metrics and accelerate FIU’s ranking as one of the top public universities in Florida.
Furthermore, with automated, self-service analytics, FIU’s Analysis and Information Management team eliminated IT contracts with third-party providers to save the university millions of dollars. Doing so has shifted attention to developing new, creative innovations that serve the university better; such as qualitative analytics tools that reflect student feedback or What-If based tools for strategic planning with school rankings.