Tableau Public at Mountlake Terrace High School


It was exactly a decade ago that I took my first foray into journalism working as a staff reporter on my high school newspaper. That’s why I was so tickled to stop in and give a little Tableau Public tutorial to the students of Mountlake Terrace High School (one of my high school’s rivals!) earlier this week. MTHS has a fantastic team of journalists working on their school publication: The Hawkeye. The reporters at The Hawkeye have even started to experiment with data journalism, making this Tableau viz last year based on a survey of students' religious beliefs:

Together, we walked through the basics of building charts in Tableau by taking a look at their football records using data I scraped from MaxPreps using Import.io. Looking at a decade of football games, it’s easy to see that Mountlake Terrace has been really stepping up on the field the last couple of years.

To get the data, I built an Import.io extractor based on MTHS Football’s Fall 2014 season page on MaxPreps. You can learn more about import.io extractors here.
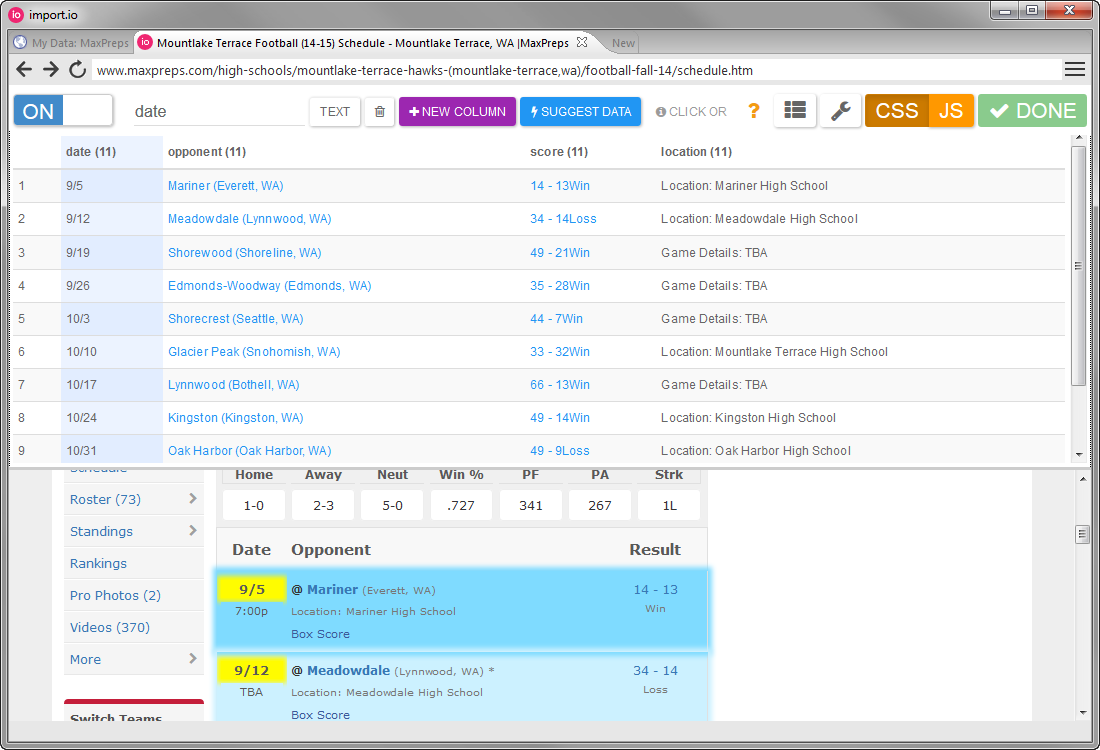
Building an extractor in import.io.
Once I had the extractor built, I did a bulk extract using the URLs of all the pages of the previous seasons listed on MaxPreps.
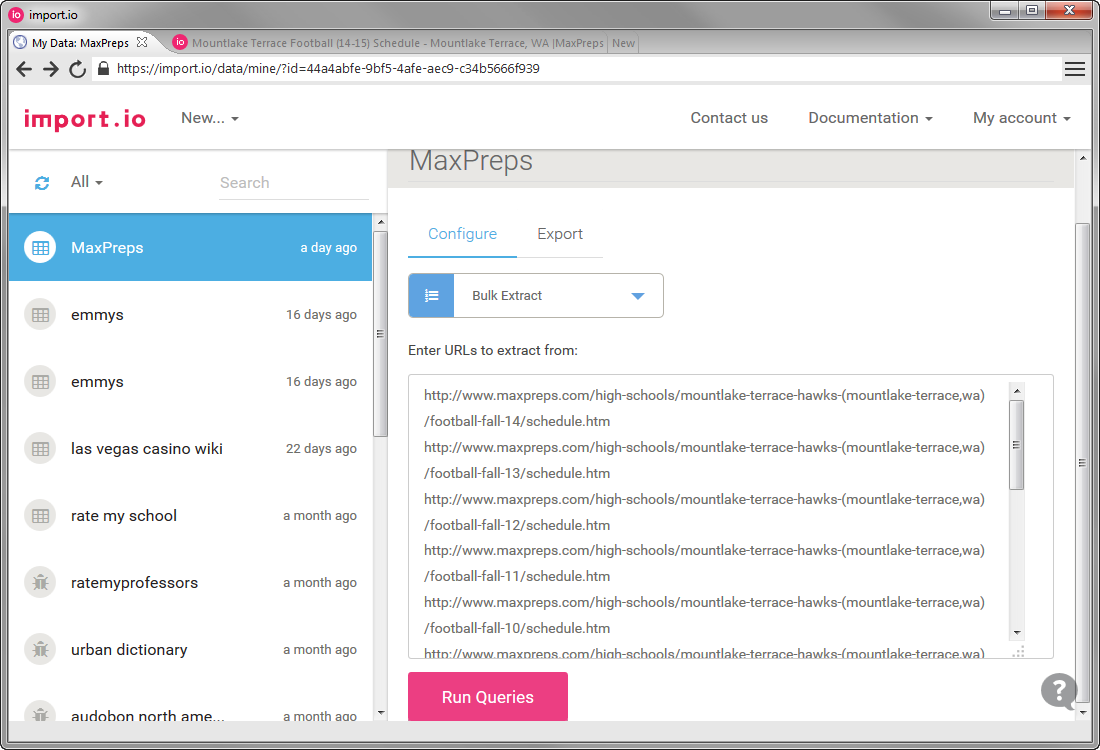
Getting data for 10 football seasons.
Once the data looked good, making the viz was easy. If you want to play with the data yourself, you can download it here. You can watch how we did it in the video below:
And if you want to access the links shown in my slides, you can click through them on this slideshare:
If you are a high school journalist and want to get started with data journalism, shoot us a line at public@tableau.com and we'd love to help you out!
관련 스토리

Iron Viz 2026: Read Between the Data
 2026/05/28

Tableau's Iron Viz Winners

Explore the 2026 Iron Viz Entries
 2025/12/15