Tableau Public 9.2: Now With Mapbox Integration


We're excited to announce the release of Tableau Desktop, Public Edition 9.2! This latest release of our award-winning data visualization software is now available to download for free for Mac and Windows.
So What's New in 9.2?
Mapbox Integration
Maps are one of the most common visualization types used by Tableau Public authors. Just take a look at our Viz of the Day Gallery, and you'll quickly notice that many of the chosen vizzes feature maps.
And we have a track record of partnering with the experts in online mapping to bring enhancements to our community. Last year, we partnered with Stamen to deliver a completely redesigned mapping suite along with version 8.2. We're not letting this year come to an end without continuing this tradition: 2015 is hereby the year that we deliver Mapbox integration, giving you the ability to build great looking map backgrounds and add layers and context.
Check out this dashboard, where we show red wine production in France using four different Mapbox styles:

If you don't have one already, you'll need to create a Mapbox account and use your Mapbox API key when you connect Tableau Public via Map > Background Maps > Map Services > Add > Mapbox Maps. Mapbox accounts are free for users who drive 50,000 views or less per month to their maps. For pricing of accounts with higher traffic than that, see Mapbox's Plans & Pricing page.
With your Mapbox account, you can immediately access 14 pre-built map templates directly in Tableau Public 9.2. If you'd like a more custom look, you can always design your own map template using Mapbox Studio. Anya A'Hearn has an excellent tutorial on how to do this on her website DataBlick.
New Map Data
Tableau Public is popular all over the world, with over 65% of all views of Tableau Public vizzes this year coming from outside of North America. Since we have this incredible international user community and reader base, we're committed to continually adding more international map data to our offerings, such as local name synonyms for world capitals, and Japanese postal codes:
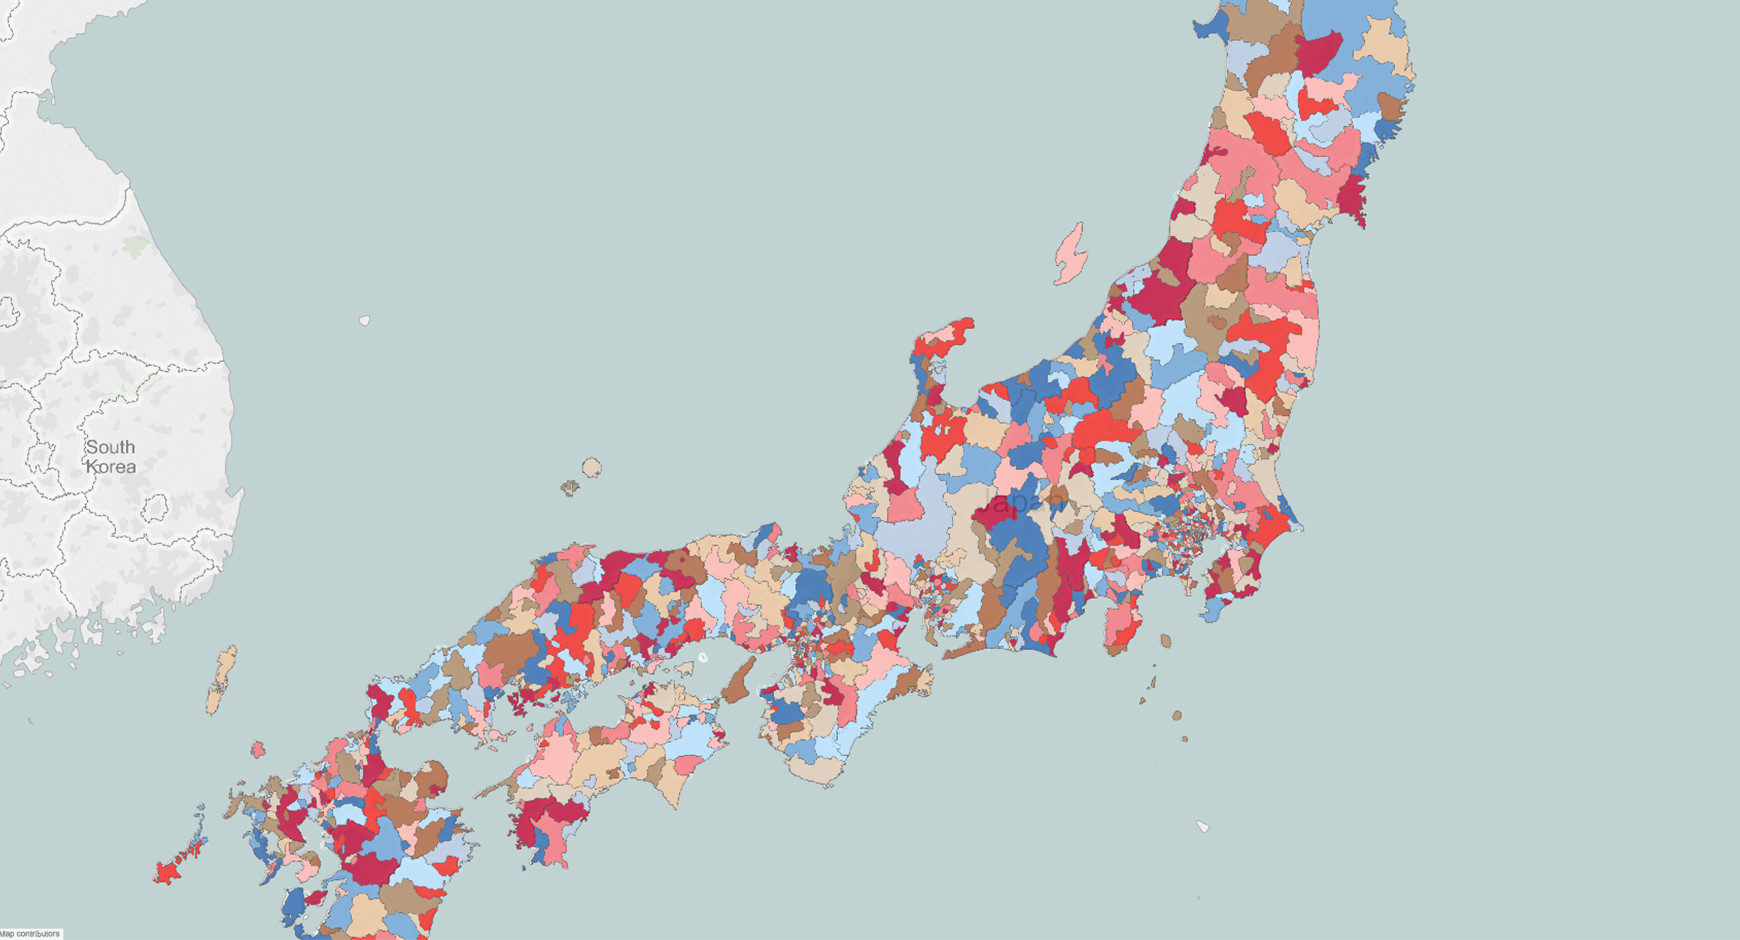 New map layers in Tableau Public 9.2, including Japanese Postal Codes
And we're not forgetting the importance of keeping existing map data fresh, such as U.S. Congressional Districts for the 114th Congress - a much needed refresh ahead of an important year for political maps in the United States.
Hierarchical Treemaps
Treemaps are a great way to visualize hierarchical data, especially when the individual boxes add up to a meaningful whole. We launched Treemaps with version 8.0 back in 2013, and now they're getting a much deserved finishing touch. Treemaps now show hierarchical data more clearly by introducing borders around the first level of grouping. The idea "Treemap Borders to separate different levels of detail" posted by Joshua Milligan on our Ideas Forum clearly shows why this is a helpful addition. Thanks Joshua!

New Label Options
In previous versions of Tableau Public, authors could control the color of Labels quite easily, but all the of Labels had to be the same color. The idea to allow authors to include different Label colors based on a data field - either a dimension or a measure - was also submitted by users on our Ideas Forum. Christmas is coming a couple weeks early for users like Nick Cheng and John Sobczak. Again, thanks for the ideas, and keep them coming!

That's Not All
For a full list of all the new features in Tableau 9.2, many of which made their way into our free offering, visit the Tableau 9.2 New Features Page. We're also giving you the ability to move total and subtotal rows and columns to where you want them, keep your recently selected colors across sessions, more easily use Sheets as Dashboard Filters, and spend less time cleaning your messy data, among other time-saving features.
As always, be sure to let us know your favorite new features by leaving a comment, or tweeting our new team Twitter account, @tableaupublic.
관련 스토리

Iron Viz 2026: Read Between the Data
 2026/05/28

Tableau's Iron Viz Winners

Explore the 2026 Iron Viz Entries
 2025/12/15