2016/12/30
Readers' Choice: Top 5 Vizzes of 2016


What a wild year 2016 has been! And now that it's coming to a close, we can take some time to look back and reflect on the best of the Tableau Public world from the past year. It's time to unveil the top 5 vizzes of the year as chosen by you! We counted down our favorite 25 vizzes from a year of Viz of the Day winners. And from that pool, you, the community, voted to select your favorites. We've tallied the votes, so, without any further ado, here are the winners!
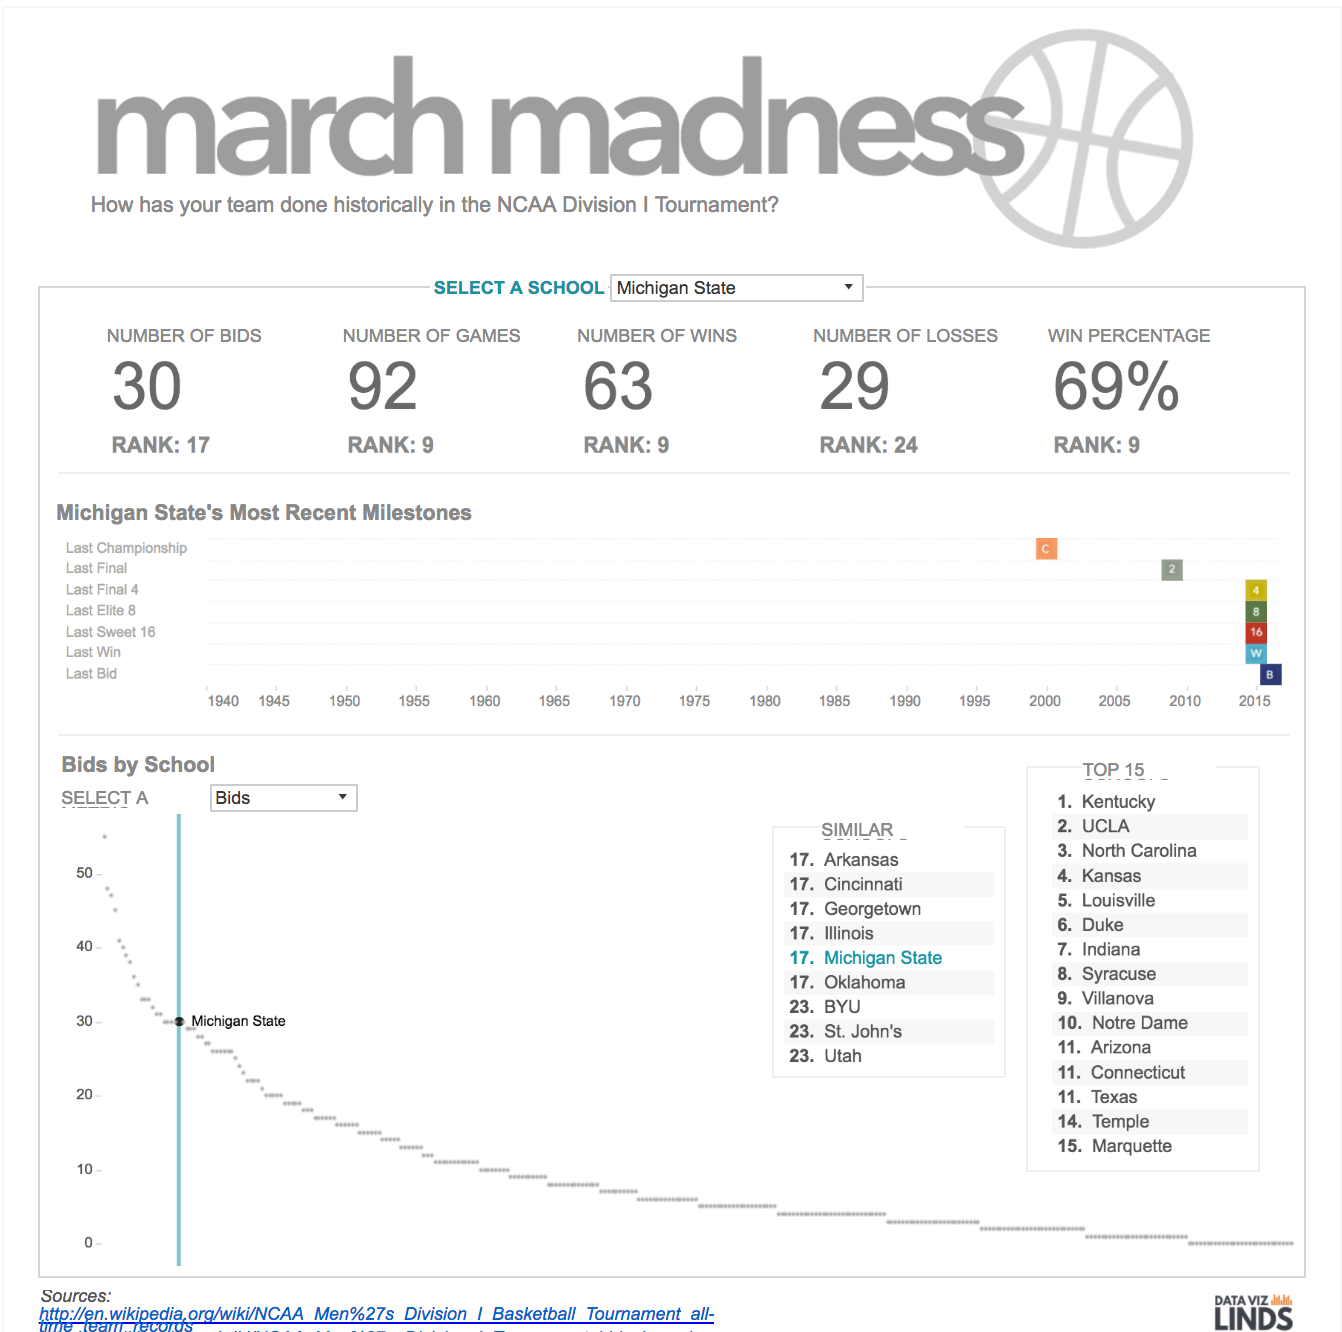
5. Lindsey Poulter: March Madness
4. Skyler Johnson: The Spells of Harry Potter

3. Adam McCann: Beatles Analysis

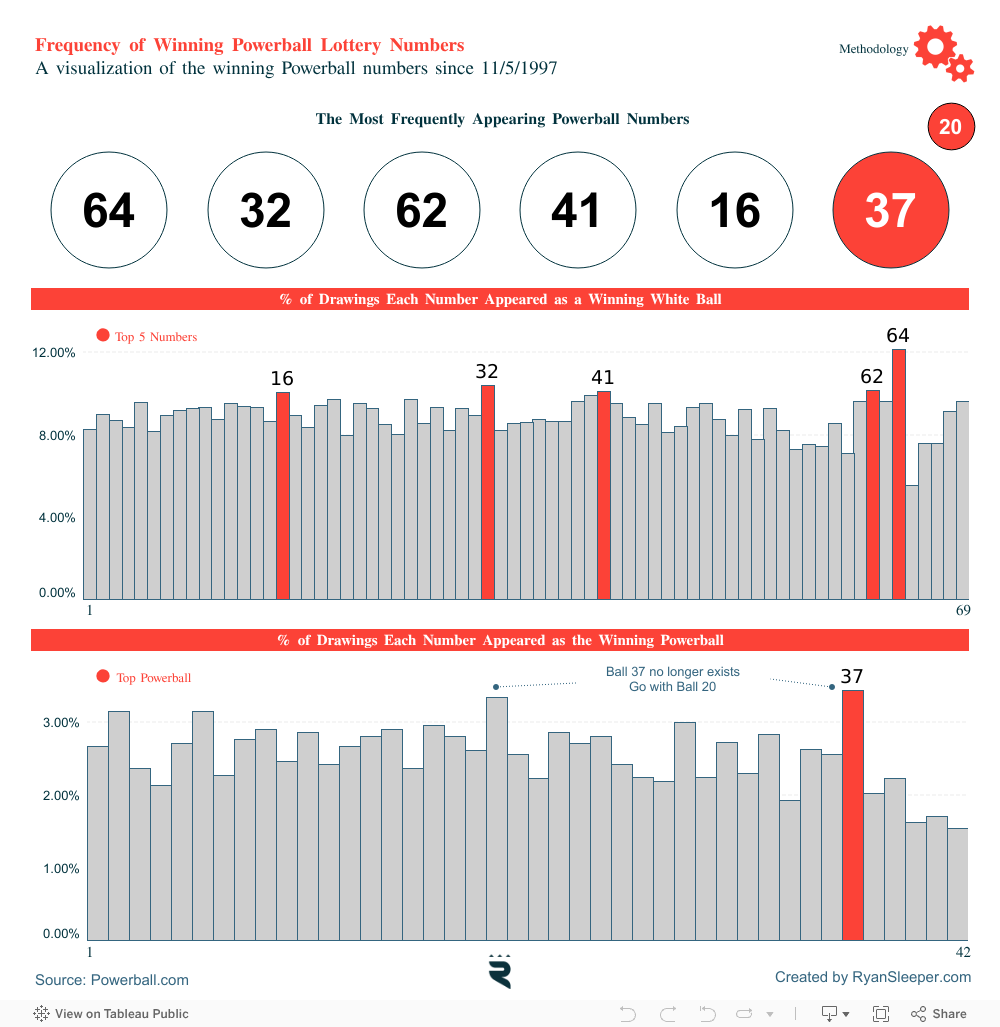
2. Ryan Sleeper: Frequency of Winning Powerball Numbers
1. Ryan Rowland: Forecasting the 2016 Election

Congratulations to all of our winners! The Tableau Public team is excited to see what kind of inventive, informative, and interesting data visualizations our wonderful community comes up with this year. Cheers to 2017!
관련 스토리

Iron Viz
Iron Viz 2026: Read Between the Data
 2026/05/28
The 2026 Iron Viz stage was set, the finalists showcased their data visualization and storytelling skills, and a champion was crowned at Tableau Conference. Catch all the highlights, big reveal, and relive the magic of the 16th edition of this competition.

Iron Viz
Tableau's Iron Viz Winners
A collection of the winners' visualizations of Tableau's Iron Viz Championship.

Iron Viz
Explore the 2026 Iron Viz Entries
 2025/12/15
Explore the 122 visualizations submitted during the 2026 Iron Viz global qualifier contest. The 2026 theme was food and drink.