Iron Viz 2019 Music Results


The results are in for the second Iron Viz global qualifier! We received 101 entries—the most we’ve ever received for any Iron Viz competition. There can only be one winner but everyone who participated should be extremely proud of their work! Read on to find out who will be advancing to compete live on stage for the Iron Viz Championship at Tableau Conference 2019 (#data19) in Las Vegas.
For this qualifier, we challenged you to visualize music data using any public data set of your choosing. We’re excited to announce that 46% of the submissions were from first-time entrants!
How the judging works
Iron Viz judging has been a hotly-debated topic in the community. In an effort to be as transparent as possible, we’ve summarized how the process works.
First-round judges from the community scored each viz, narrowing the list to a Top 10
We asked Tableau Ambassadors, Zen Masters, past Iron Viz finalists, and others active in the community to help us narrow down all 101 entries to a Top 10 that advanced to our final-round guest judges. With more entries than ever before, we appreciate the thoughtfulness of our first-round community judges and their commitment to being fair.
A huge THANK YOU to these first-round judges who volunteered their time and expertise: Corey Jones, Emily Kund, Emma Whyte, Lilach Manheim, Simon Beaumont, Siroros Roongdonsai, and Steve Wexler!
Each entry was scored by multiple judges to minimize any potential bias. After the judges scored entries on Analysis, Design, Storytelling, each score was converted into a percentile rank for each judge. Each of these percentile ranks were then averaged across all judges. This method helps ensure that the scores are fairly distributed and not impacted by any one judge’s propensity to score easier or harder than others.
Final-round guest judges scored the Top 10 vizzes and selected a winner
Next, our final-round guest judges independently reviewed the Top 10 vizzes and scored each based on the same criteria as the first-round judges. THANK YOU to our guest judges Alberto Cairo, Nicholas Rougeux, Tom Barber, and Valentina D’Efilippo.
“When I was approached to be a judge for Iron Viz, I was excited to see the creative ways people would visualize music and I wasn't disappointed," commented Rougeux. "Each entry took me on a journey about a different set of music and opened my eyes to new visualization techniques I wasn't aware of—the whole process was a fantastic learning experience."
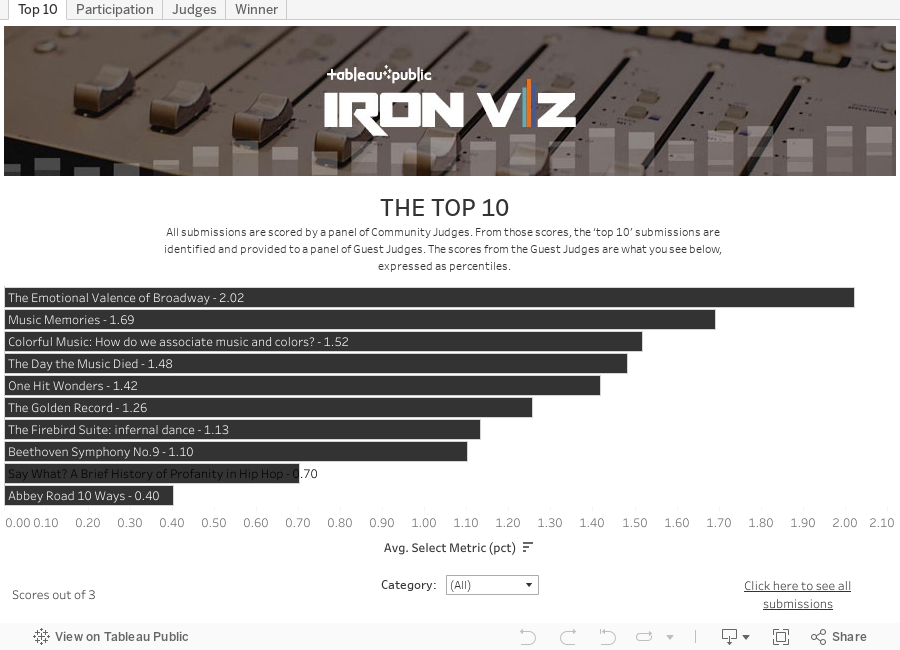
Check out the Top 10 entries
With the most entries ever, our first-round judges had a difficult task! Take a look at which entries made the Top 10, and don't forget to explore all 101 entries:
And the winner is…
The Emotional Valence of Broadway by Lindsey Poulter
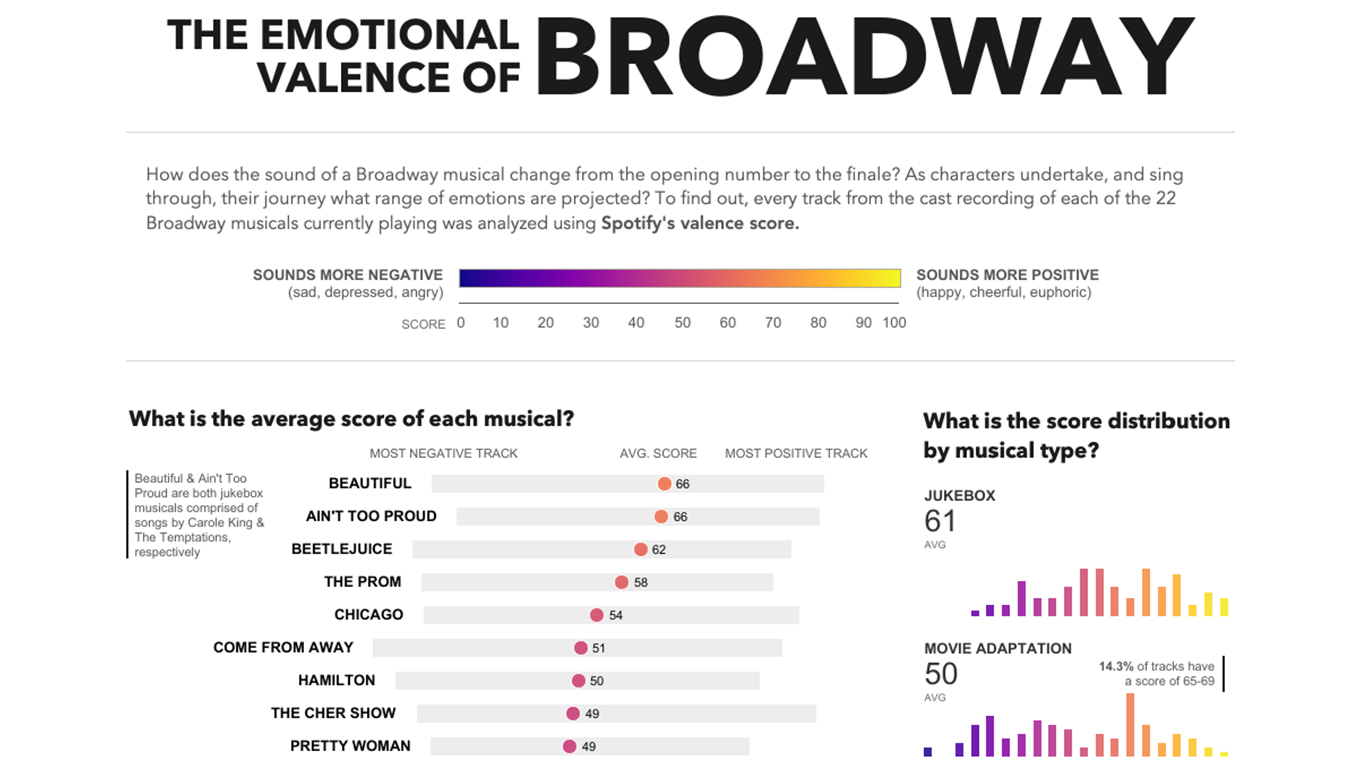
“This is a clear and effective data-driven story. It's simple and to the point and the design effectively maintains consistency from one chart to the next making the reader experience frictionless,”- Guest Judge Valentina D'Efilippo
In each qualifier, we also recognize the newcomer with the highest score. Lindsey is not only the winner of this qualifier, but also the highest scoring newcomer. Congrats to Lindsey! Help give her a standing ovation by following her on Tableau Public!
Want to challenge yourself by participating in Iron Viz? Stay tuned for the announcement of our third and final global qualifier!
A quick note on feedback
Please note: The first-round judges determined that all submission feedback would be provided in the format of numerical scores only, and not written comments. If you are one of the 101 entrants, you should be receiving your numerical score shortly.
관련 스토리

Iron Viz 2026: Read Between the Data
 2026/05/28

Tableau's Iron Viz Winners

Explore the 2026 Iron Viz Entries
 2025/12/15