DataFam Roundup: March 6-10, 2023


Welcome! Dig into this week's DataFam Roundup—a weekly blog that brings together community content all in one post. As always, we invite you to send us your content—and the DataFam content from your peers that have inspired you! Find the content submission form here.
Community Highlight
To recognize new and consistent Tableau contributors—we’re excited to have a section within the weekly DataFam Roundup called the Tableau Community Highlight. Find out how to get involved.

DataKo, Data Analyst and Data Visualization VTuber
DataKo is a data analyst at an engineering company by day and visualizes data as a VTuber, an online creator who uses a virtual avatar, on Twitch (@DataKoStreaming) by night. She began using Tableau in 2019 and found the Community Forums, DataFam Community Jam webinars, and other online resources incredibly helpful in her initial learning of Tableau.
DataKo uses her VTuber alias as an outlet to truly be themselves and create vizzes on topics that interest them, such as anime. By building dashboards on Twitch, their main goal is to reach an audience that may not have a strong relationship with data or realize how much knowledge is really at their fingertips. She hope to empower their viewers, called their “Data Base”, to make more sense of the world through data visualization.
In the near future, DataKo is looking forward to working through her extensive list of pop culture focused dashboards, here are some of their ideas for future vizzes:
- "stock market" style analysis of her Animal Crossing island's turnip-based "Stalk Market"
- analysis of the age of anime protagonists
- toppings used on the specialty pizzas at global locations of Domino's
Connect with DataKo on Tableau Public, Twitch, at Japan TUG events, and at Tableau Conference!
Women's History Month with the Tableau Community
- Weekly Viz of the Day's Each week Tableau Public will be featuring a viz celebrating Women's History Month.
- Community Data Visualization Challenges: The DataFam has launched a series of data challenges celebrating Women's History Month. Check them out below!
-
Back to Viz Basics - Visualize Data in a Timeline: As we celebrate International Women's Day and Women's History Month, it's important to recognize the incredible contributions that women have made to our world. In honor of this occasion, this week's data is on Nobel Prize laureates (a person who is honored with an award for outstanding creative or intellectual achievement), with a particular focus on the achievements of female laureates.
-
ProjectHealthViz - Impact of Endometriosis on in Vitro Fertilization Outcomes – Data set from a research paper and aims to highlight the invisible struggle many women with endometriosis face when trying to get pregnant. March is Women’s History Month and it’s important to bring awareness to fertility struggles and the huge hurdles women and their partners go through in hopes of having a family.
-
Diversity in Data - A compilation by Thoughtco.com of the 100 most popular women in history by internet searches
-
DataFam content
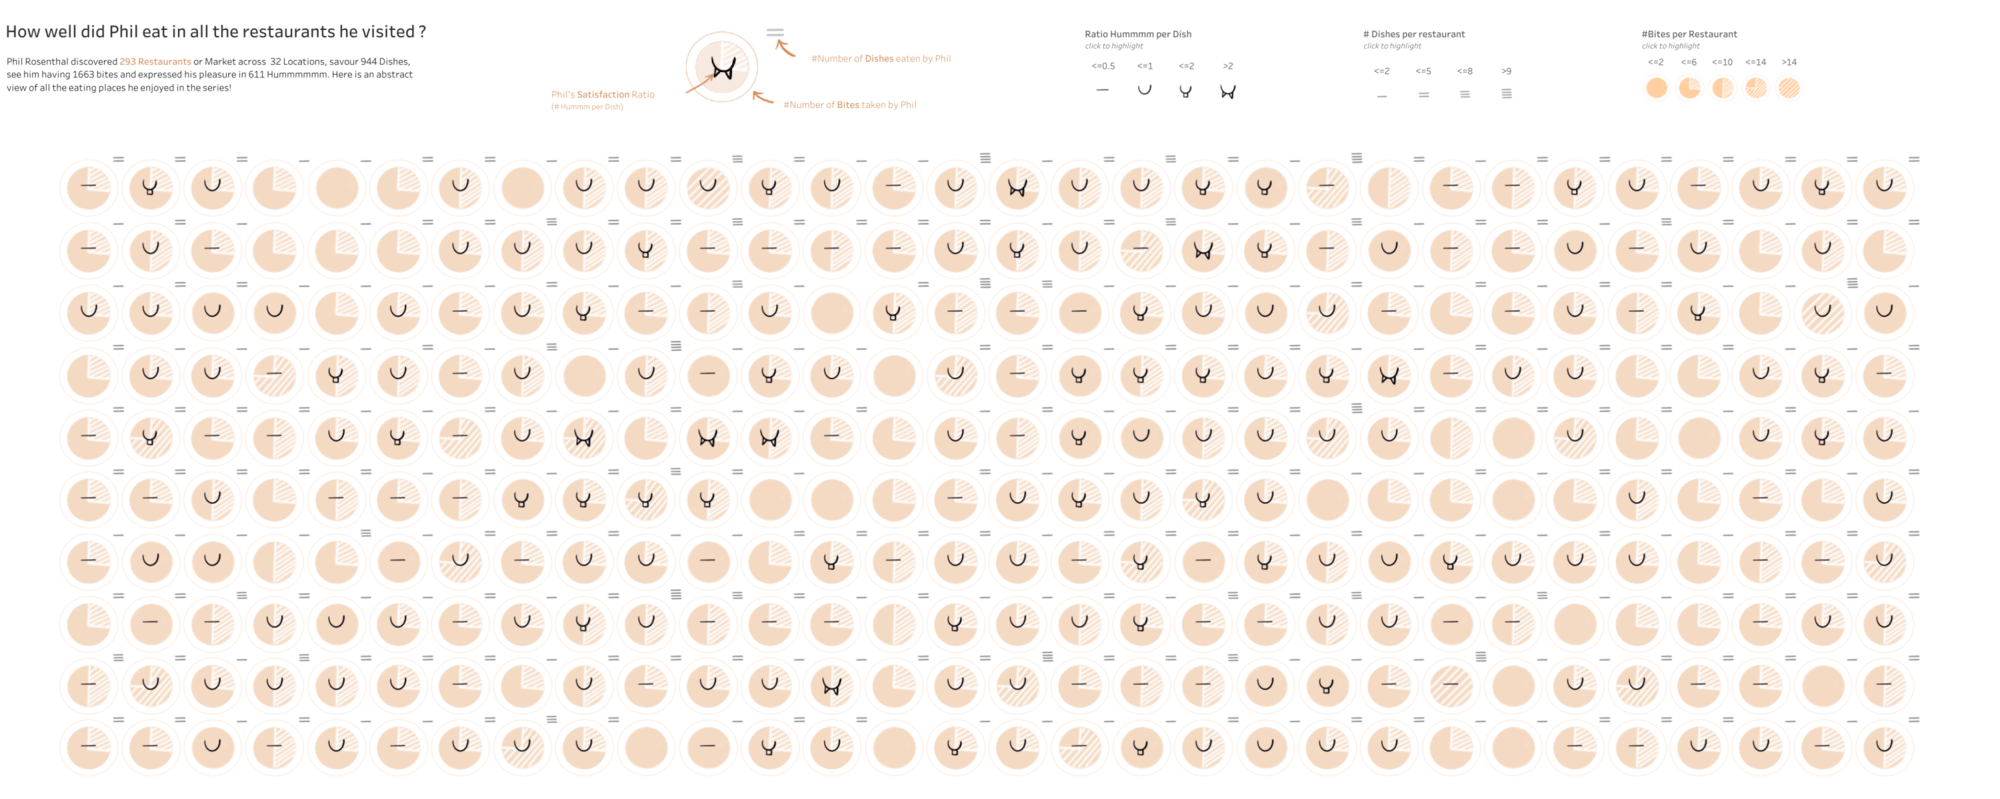
Annabelle Rincon, Rativiz: Somone feed phil-the viz!
Dive into content created by the Tableau Community:
- Flavio Matos: My Data Heroes
- Donabel Santos, sqlbelle: Tableau, LOD and SQL - Behind the scenes
-
Annabelle Rincon, Rativiz: Somone feed phil-the viz!
-
Kevin Flerlage, The Flerlage Twins: What Size Should Your Dashboard Be?
-
Nicole Lillian Mark: Meet the DataFam o8: Lawrence Durbin
Team Tableau
Upcoming events and community participation
-
Data Super Star: The theme of this competition is insightfulness, navigability, and user-friendliness. We are looking for BUSINESS DASHBOARD that effectively communicate key insights and patterns in the data, allow for easy exploration, and provide a positive user experience.
-
Dataviz Conferences to not miss in 2023 Are you ready to join the global dataviz community? Fortunately, there are a number of amazing conferences held throughout this year that can help you network with your peers, uncover new learnings, give you memories, and lot of fun. Let’s check them.
-
Data Superstar: Get ready for a data visualization extravaganza! Our competition is all about showcasing the best and brightest in data visualization. The theme of this competition is insightfulness, navigability, and user-friendliness. We are looking for visualizations that effectively communicate key insights and patterns in the data, allow for easy exploration, and provide a positive user experience.
-
Community Calendar and Upcoming Events: stay up-to-date on the latest Women in Dataviz events and other data visualization-related events. If you'd like to submit an event to the calendar, please fill out this form.
Vizzes
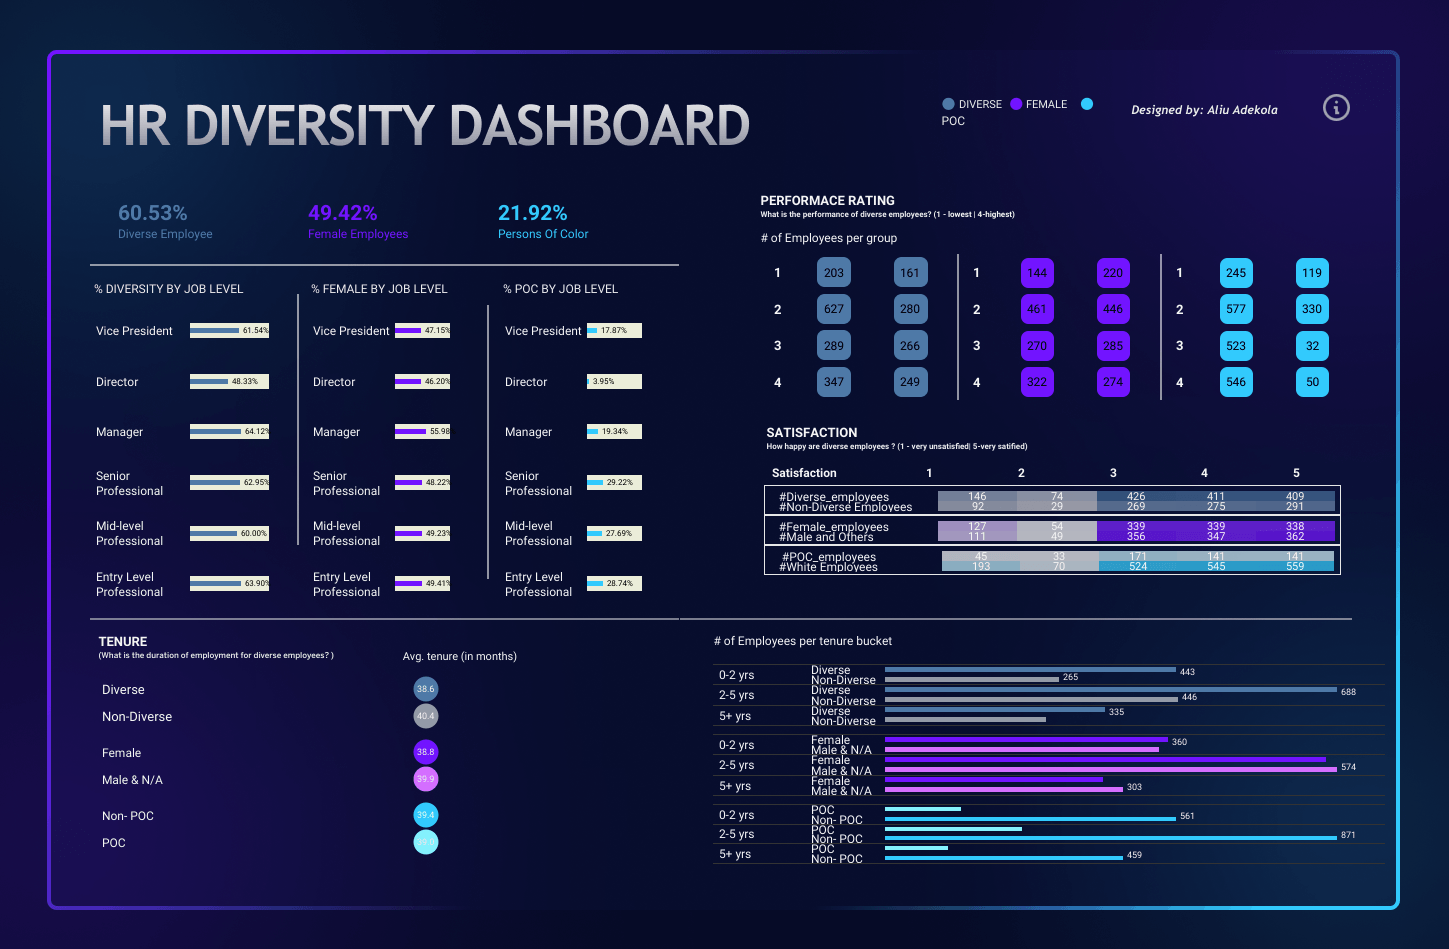
Aliu Adekola: HR Diversity Dashboard
See the latest Viz of the Day, trending vizzes, featured authors, and more on Tableau Public.
Check out some inspirational vizzes created by the community:
-
Idris Akilapa: 20 ways to design your KPI
-
Nur Adhyaksa: #VizForSocialGood - Video Vounteer
-
Sarah Pallett and Anne-Sophie Pereira De Sá: Ted Lasso Pop Culture References
-
Lindsay Betzendahl: International Women's Day - Healthcare Salaries
-
Louis Yu: Switching Color Hierarchies
-
Abbie Taylor: BAFTA Film Awards
-
Aliu Adekola: HR Diversity Dashboard
-
Sam Epley:
-
Ant Pulley: #WOW2021 Week11 Recreate Hans Rosling
Community Projects
Back 2 Viz Basics
A bi-weekly project helping those who are newer in the community and just starting out with Tableau. Not limited just to newbies!
Web: Back 2 Viz Basics
Twitter: #B2VB
Week 5: Visualize Data in a Timeline
Workout Wednesday
Build your skills with a weekly challenge to re-create an interactive data visualization.
Web: Workout Wednesday
Twitter: #WOW2022
Week 10: Let’s practice Device Designer
Makeover Monday
A weekly social data project.
Web: Makeover Monday
Twitter: #MakeoverMonday
Week 10: Meat production in Germany
Preppin' Data
A weekly challenge to help you learn to prepare data and use Tableau Prep.
Web: Preppin’ Data
Twitter: #PreppinData
Week 10: What's my Balance on this day?
DataFam Con
A monthly challenge covering pop culture and fandoms.
Web: DataFam Con
Twitter: #DataFamCon
February 2023: (Reality) Love is in the Air!
EduVizzers
A monthly project connecting real education data with real people.
Web: Eduvizzers
March 2023: Strategic Measure Number of Apprenticeship and Internship Positions Offered by the City of Austin
Games Night Viz
A monthly project focusing on using data from your favorite games.
Web: Games Nights Viz
Twitter: #GamesNightViz
Level 6: The Final Boss
Iron Quest
Practice data sourcing, preparation, and visualization skills in a themed monthly challenge.
Web: Iron Quest
Twitter: #IronQuest
November 2022: Weird or Wonderful
Storytelling with Data
Practice data visualization and storytelling skills by participating in monthly challenges and exercises.
Web: Storytelling with Data
Twitter: #SWDChallenge
February 2023: partner up
Project Health Viz
Uncover new stories by visualizing healthcare data sets provided each month.
Web: Project Health Viz
Twitter: #ProjectHealthViz
March 2023: Impact of Endometriosis on in Vitro Fertilization Outcomes
Diversity in Data
An initiative centered around diversity, equity & awareness by visualizing provided datasets each month.
Web: Diversity in Data
Twitter: #DiversityinData
March 2023: Women's History Month
Sports Viz Sunday
Create and share data visualizations using rich, sports-themed data sets in a monthly challenge.
Web: Sports Viz Sunday
Twitter: #SportsVizSunday
January 2023: Is it a Sport or a Game?
Viz for Social Good
Volunteer to design data visualizations that help nonprofits harness the power of data for social change.
Web: Viz for Social Good
Twitter: #VizforSocialGood
Feb 17 - Mar 17, 2023: Video Volunteers - India
Real World Fake Data
Create business dashboards using provided data sets for various industries and departments.
Web: Real World Fake Data
Twitter: #RWFD
Session 5: Diversity Score Card
Data Plus Music
A monthly project visualizing the data behind the music we love!
Web: Data Plus Music
Twitter: #DataPlusMusic
관련 스토리

DataFam Roundup June 2026

DataFam Roundup May 2026

Iron Viz 2026: Read Between the Data
 2026/05/28