DataFam Roundup: June 9-13, 2025


Welcome! Dig into this week's DataFam Roundup—a weekly blog that brings together community content all in one post. As always, we invite you to send us your content—and the DataFam content from your peers that have inspired you! Find the content submission form here.
Community Highlight
To recognize new and consistent Tableau contributors—we’re excited to have a section within the weekly DataFam Roundup called the Tableau Community Highlight. Find out how to get involved.

Maria Elisa Londono, Tableau User
Florida, USA
Maria Elisa Londono utilizes Tableau for both professional endeavors and personal growth, aiming to expand her creative boundaries and explore data visualization as a non-designer. She credits a lot of the development in her Tableau journey to support provided by other members of the DataFam through mentorship and content.
Currently, Maria Elisa engages with the Tableau Community via LinkedIn, where she shares content and interacts with the DataFam, and by participating in community projects like Makeover Monday. She values the supportive environment of the community, which fosters collaboration over competition and makes learning accessible, particularly for newcomers. She's also involved with the Tableau + Maps User Group due to her interest in maps and data visualization, and enjoys connecting with others who share this same passion for spatial storytelling.
Connect with Maria on Linkedin and Tableau Public.
DataFam Content
- Jacob Rothemund: Datafam Slam Tableau Tip Battle from Vizit Sydney
- Fi Crocker: Future Proof Your Data Career AI, Soft Skills & Growth Tips with Andy Kriebel & Eva Murray
-
Johan de Groot: Two Pie Chart Alternatives
- Deepak Holla:
- Steve Adams:
Team Tableau Content
Visualizations
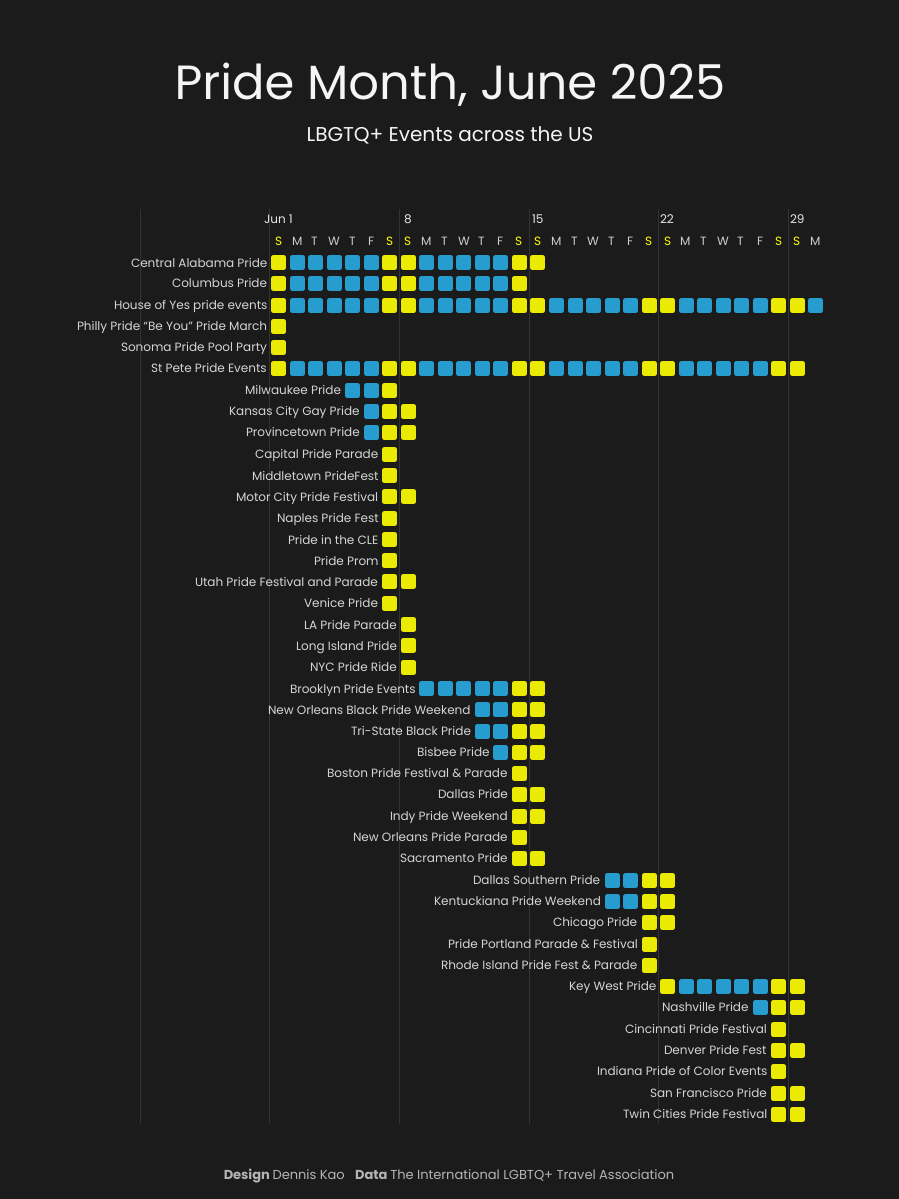
Dennis Kao: Pride Month June 2025
See the latest Viz of the Day, trending vizzes, featured authors, and more on Tableau Public.
Check out some inspirational vizzes created by the community:
-
Erik Rettman: Highest Grossing Horror Films
-
Shangruff Raina: World Crude Steel Production
-
Veronica Simoes: Dashboard Social Media and Mental Health
-
Jacob Rothemund: Seven Bar Charts to Visualise Year-Over-Year Growth
Community Projects
Back 2 Viz Basics
A bi-weekly project helping those who are newer in the community and just starting out with Tableau. Not limited just to newbies!
Web: Back 2 Viz Basics
X: #B2VB
Workout Wednesday
Build your skills with a weekly challenge to re-create an interactive data visualization.
Web: Workout Wednesday
X: #WOW2022
Preppin' Data
A weekly challenge to help you learn to prepare data and use Tableau Prep.
Web: Preppin’ Data
X: #PreppinData
Makeover Monday
Create business dashboards using provided data sets for various industries and departments.
Web: Makeover Monday
X: #MakeoverMonday
Data ChangeMakers
Volunteer to design data visualizations that help nonprofits harness the power of data for social change.
Web: Data ChangeMakers
Visual Climate
Collaborate and share climate data.
Web: Visual Climate
X: #VisualClimate
DataFam Con
A monthly challenge covering pop culture and fandoms.
Web: DataFam Con
X: #DataFamCon
EduVizzers
A monthly project connecting real education data with real people.
Web: Eduvizzers
Games Night Viz
A monthly project focusing on using data from your favorite games.
Web: Games Nights Viz
X: #GamesNightViz
Iron Quest
Practice data sourcing, preparation, and visualization skills in a themed monthly challenge.
Web: Iron Quest
X: #IronQuest
Storytelling with Data
Practice data visualization and storytelling skills by participating in monthly challenges and exercises.
Web: Storytelling with Data
X: #SWDChallenge
Project Health Viz
Uncover new stories by visualizing healthcare data sets provided each month.
Web: Project Health Viz
X: #ProjectHealthViz
Diversity in Data
An initiative centered around diversity, equity & awareness by visualizing provided datasets each month.
Web: Diversity in Data
X: #DiversityinData
Sports Viz Sunday
Create and share data visualizations using rich, sports-themed data sets in a monthly challenge.
Web: Sports Viz Sunday
X: #SportsVizSunday
Real World Fake Data
Create business dashboards using provided data sets for various industries and departments.
Web: Real World Fake Data
X: #RWFD
Data Plus Music
A monthly project visualizing the data behind the music we love!
Web: Data Plus Music
X: #DataPlusMusicCommunity Projects
관련 스토리

DataFam Roundup June 2026

DataFam Roundup May 2026

Iron Viz 2026: Read Between the Data
 2026/05/28