DataFam Roundup: December 13 - 17, 2021


Dig into the latest DataFam Roundup—a weekly blog that brings together community content all in one post. As always, we invite you to send us your content—and the DataFam content from your peers that have inspired you! Find the content submission form here.
DataFam content
Ant Pulley: Decorate Your Own Tree – A Walkthrough
Dive into content created by the Tableau Community:
- Prasann Prem: Buddy Talks: Tableau Performance Optimisation Tips
- Nir Smilga: Data viz Colors: The Good the Bad (and the Ugly)
- CJ Mayes: What’s Good? Tutorials & Blogging With Kevin Flerlage. (December)
- Mark Bradbourne, Just 5 Minutes: Is Blogging Dead? Audience Thoughts!
- Eric Balash, The Tableau Student Guide: Teaser Week - Build Your Best Bar Chart
- Darragh Murray: How to move your X-axis labels to the top of a chart in Tableau
- Nicole Klassen: Tips for Collaborating in Tableau
- Ant Pulley: Decorate Your Own Tree – A Walkthrough
- Hamouchi Imad, BI Tips Boy: Tableau Tips - Highlighting Max and Min
- Rosario Gauna, Rosarioviz: Frequency Matrix Redux
- Shivakumar Gokaram, MuleSoft: How global governments create data dashboards with MuleSoft and Tableau
- Zach Bowders, Data + Love: Will Sutton
- InterWorks: Tableau Conference Recap
- Sean Miller, HipsterVizNinja: #WOW2021 | 50 | Tableau Challenge | Sales Drilldown
- Steve Adams: The Catch 22 of learning Tableau and how to overcome it
- Jonathan Drummey, Action Analytics: TSVP #11: Data Duplication using Relationships vs. Self-Join or Union
Upcoming events and community participation
- Stay up to date with the latest and greatest from the Tableau Community. We'll help you along in your Tableau journey, bring your data skills to the next level, and nurture powerful connections.
- #IronQuest Feedback: In order to make the project even better in 2022, please share your feedback.
- Data Book Club: Anyone who is interested in reading a book about data and discussing it with others are welcome to sign up!
- Tableau's Next Nominee Form: Share who you think should be considered in Tableau's Next. Please note this is a list of people newer to the community who are not yet Zen Masters or Ambassadors but have been doing incredible work.
- Sign up to be a panelist for the 3charts@3 Live: A Mystery Chart Show featuring topics like personal finance, energy, healthcare and more!
Vizzes
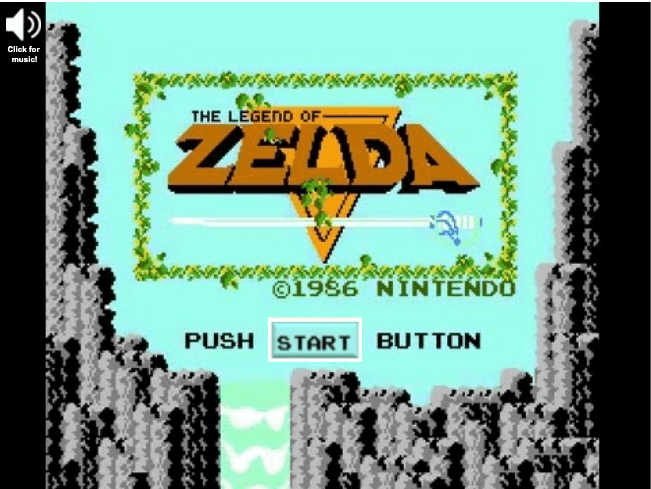
Turner Family: Zelda Game
Catch this week’s Viz of the Days here and subscribe to get them emailed directly to your inbox.
Check out some inspirational vizzes created by the community:
- Eve Thomas: All I Want for Christmas is...
- Lisa Trescott: 12 Days of Christmas
- Nicole Klassen: #VizforSocialGood Community Survey 2021
- Lindsay Betzendahl: Generating Vizzes - My Tableau Public Data
- Saloni Goel: Fast Food Restaurant Chains
- Jeremy Johnson: Rockin' Around The Rockefeller Tree
- Turner Family: Zelda Game
- Muhammad Azhar: SpotifyTop 50 | 2020
- Ha PL: Georgia oKeeffe
- Alexander Mou: The Nutrition of Tree Nuts
Community Projects
Back 2 Viz Basics *NEW!
A bi-weekly project helping those who are newer in the community and just starting out with Tableau. Not limited just to newbies!
Web: Back 2 Viz Basics
Twitter: #B2VB
2021 Teaser: Build Your Best Bar Chart
Games Night Viz *NEW!
A monthly project focusing on using data from your favorite games.
Web: Games Nights Viz
Twitter: #GamesNightViz
November - December 2021: Level 1: Player Select
Workout Wednesday
Build your skills with a weekly challenge to re-create an interactive data visualization.
Web: Workout Wednesday
Twitter: #WOW2021
Week 50: Can you recreate this drill down?
Preppin' Data
A weekly challenge to help you learn to prepare data and use Tableau Prep.
Web: Preppin’ Data
Twitter: #PreppinData
Week 41: Southend Stats
Iron Quest
Practice data sourcing, preparation, and visualization skills in a themed monthly challenge.
Web: Iron Quest
Twitter: #IronQuest
Storytelling with Data
Practice data visualization and storytelling skills by participating in monthly challenges and exercises.
Web: Storytelling with Data
Twitter: #SWDChallenge
December 2021: cheers to the holidays
Project Health Viz
Uncover new stories by visualizing healthcare data sets provided each month.
Web: Project Health Viz
Twitter: #ProjectHealthViz
December 2021: Trends in Youth Sports
Diversity in Data
An initiative centered around diversity, equity & awareness by visualizing provided datasets each month.
Web: Diversity in Data
Twitter: #DiversityinData
November - December 2021: The countdown to Christmas and New Year!
SDG Viz Project
Visualize data about Sustainable Development Goals provided by the World Health Organization.
Web: SDG Viz Project
Twitter: #TheSDGVizProject
Sports Viz Sunday
Create and share data visualizations using rich, sports-themed data sets in a monthly challenge.
Web: Sports Viz Sunday
Twitter: #SportsVizSunday
November 2021: Tableau Conference
Viz for Social Good
Volunteer to design data visualizations that help nonprofits harness the power of data for social change.
Web: Viz for Social Good
Twitter: #VizforSocialGood
Nov 28, 2021 - Jan 7, 2022: visualize our community
Real World Fake Data
Create business dashboards using provided data sets for various industries and departments.
Web: Real World Fake Data
Twitter: #RWFD
Viz 2 Educate
Each month, create vizzes on global education syllabus topics as resources for teachers worldwide.
Web: Viz 2 Educate
Twitter: #Viz2educate
Makeover Monday
Join the community every Monday to work with a given data set and create better, more effective visualizations.
Web: Makeover Monday
Twitter: #MakeoverMonday
관련 스토리

DataFam Roundup June 2026

DataFam Roundup May 2026