
UT Austin relies on Tableau to find answers and fast-track progress on key campus initiatives
Confidently made decisions about unpredictable future scenarios by quickly using data analysis
Amplified data culture across the university and leadership, resulting in an increased demand for new data projects
Improved faculty award criteria through a deeper understanding of racial and gender data insights
The University of Texas at Austin is home to a diverse population of 50,000 students and 24,000 faculty and staff. A top global academic institution, it’s also one of the largest public research universities in the country, with an annual budget of more than $650 million.
To drive further success as a world-class university, Shiva Jaganathan, Chief Data Officer of Institutional Reporting, Research, and Information Systems leverages data as a strategic asset to deliver crucial insights to leadership on class structure, faculty awards, and other key areas.
Prioritizing quick wins to gain traction, Jaganathan needed an agile approach to data access. Instead of investing time and effort required for typical data management tasks—the data warehouse connecting to enterprise data resources and getting reports—he used the university data available at that time. This method expedited analytics so decision-makers could quickly gain insights and generate data demand, a core component of data culture.
Future-proofing for an unknown tomorrow
One of Jaganathan’s responsibilities was to help the leadership with recruitment and retention of top-performing faculty for university’s main areas of growth and study, which was closely linked to planning for the unplanned. Analyzing teaching effectiveness, research projects and funding, student demand, and faculty productivity, Jaganathan ensured that classes had the right faculty ratio for classes and hybrid instruction during the pandemic, and for return to campus.
Surveying and analyzing responses from students and faculty about their preferences for hybrid or remote instruction, the university was able to make short- and long-term decisions about class structure and the best use of the university’s limited campus space.
Tableau dashboards also provided the capability to model response options for future scenarios related to the pandemic or other emergency situations, offering speed and flexibility to build a more resilient experience for students and faculty.
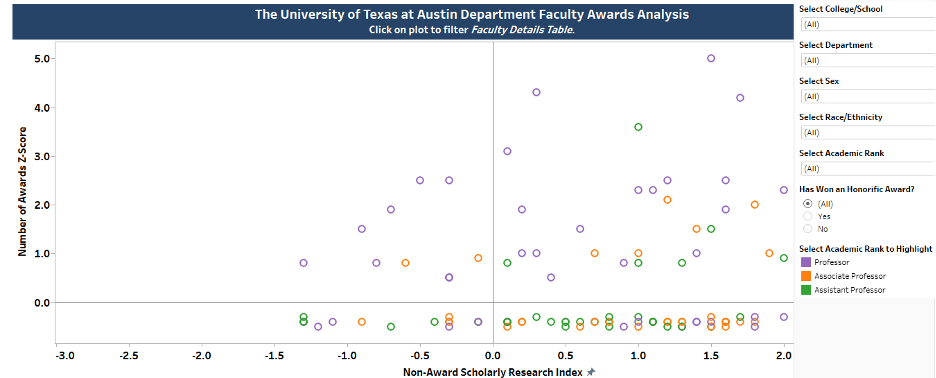
The Awards Analysis Tableau Report has proven to be a great dashboard to quickly identify under awarded faculty in each department and the options to drill down to race/ethnicity and gender dimensions provided opportunity for greater equity in the prestigious awards nomination process.
Ensuring equitable faculty awards opportunities
Dashboards were also instrumental in uncovering insights for university leadership to understand diversity, equity, and inclusion metrics among its faculty for its awards distribution. Though UT Austin consistently nominated and awarded faculty across racial and gender lines, the analysis helped the university identify and address specific gaps in the awards nomination process.
This data analysis was also crucial to understand UT Austin’s competitiveness with other peer institutions. Uncovering these insights also improved both recruitment and retention efforts. “We wanted to make sure that we are recognizing the faculty research productivity and nominating them for major awards and retaining those faculty,” Jaganathan said.
Taking a deeper dive in faculty productivity, Jaganathan’s team collaborated with an external firm, and developed a new score called “Non-awards Scholarly Research Index” to include metrics such as journal articles, citations, awards, and other indicators of productivity, then standardized that data by years of experience.
Strengthened data culture with university leadership
As a result of this partnership, the analytics team developed a Tableau dashboard for the university provost and senior leadership. This dashboard serves as one of the tools to make informed decisions on faculty awards nominations. This generated even more interest in data as leadership manages the university through a time of significant change in the higher education experience and workforce expectations.
The university’s work with Tableau also helped to foster a culture where data became an asset to drive better decision making. “Putting valuable information into the hands of decision makers will continue to foster the university’s data culture and improve its performance, no matter what changes lie ahead,” Jaganathan explains.
Putting valuable information into the hands of decision makers will continue to foster the university’s data culture and improve its performance, no matter what changes lie ahead.